Evidence Public Health
Vol. 1 No. 1 (2025)
Research Article Public Health
www.evidencejournals.com
Cite this Article
Mohanty A, Priyadarshini P, Balasubramanian S, Chenchula S, Sah R. Forecasting of monkeypox outbreak trends in the most affected countries: a join point regression modelling approach. Evidence Public Health. 2025:1(1):1-13. DOI:10.61505/evipubh.2025.1.1.5
Available From
https://eph.evidencejournals.com/index.php/j/article/view/5/

Received: 2024-11-25
Revised: 2024-12-16
Accepted: 2024-12-28
Published: 2025-01-25

Evidence in Context

• Details Mpox's global spread to 116 countries by 2024.
• Outlines Mpox virus clades: Clade I (high virulence) and Clade II (widespread).
• Notes repeated WHO PHEIC declarations due to Mpox.

• Discusses the 2022 outbreak's sexual transmission dynamics.
• Covers global case data and vaccine distribution challenges.

To view Article

Forecasting of monkeypox outbreak trends in the most affected countries: a join point regression modelling approach

Aroop Mohanty1, Priyadharshini P2, Sowntappan Balasubramanian3, Santenna Chenchula4, Ranjit Sah5*

1 Department of Microbiology, All India Institute of Medical Sciences, Gorakhpur, Uttar Pradesh, India.

2 Department of Community Medicine, Sri Lalithambigai Medical College and Hospital, Chennai, Tamilnadu, India.

3 Centre for One Health, National Centre for Disease Control, New Delhi, India.

4 Department of Pharmacology, All India Institute of Medical Sciences, Bhopal, India.

5 Steward Health Care System Dallas, USA.

*Correspondence:

Abstract

Background: The global resurgence of Mpox has emerged as a significant public health issue, with cases identified in over 116 countries by 2024. This study leverages joinpoint regression and ARIMA forecasting models to analyze Mpox trends and project future outbreaks, underscoring the need for adaptable public health responses due to varied virulence across strains.

Methods: Using joinpoint regression, we analyzed changes in Mpox case trends from January 1 to September 15, 2024, and employed ARIMA models to forecast future outbreaks in the ten most affected countries for next ten weeks.

Results: The analysis revealed significant fluctuations in Mpox cases, particularly in the United States and the Democratic Republic of Congo (DRC). Joinpoint regression detected crucial shifts in epidemic trends, while ARIMA models forecasted short-term and long-term trajectories. By October 24, 2024, Spain is predicted to report the highest new cases at 21, followed by the DRC with 9. France and Germany are expected to see 7 new cases each. In contrast, Brazil, Colombia, the UK, and the US might report only 1 new case, with no new cases expected in Mexico and Peru. The UK and US are projected to have the highest cumulative cases at 240,119 and 239,976, respectively, with Brazil and the DRC following with 87,405 and 61,867 cases.

Conclusion: This study highlights the importance of advanced modeling in predicting Mpox outbreaks and guiding tailored public health strategies. These forecasts are crucial for improving preparedness and response efforts against Mpox and other infectious diseases.

Keywords: Mpox, World, forecasting, ARIMA, join point

Introduction

The global re-emergence of Mpox, also known as monkeypox, has become a significant public health concern, with cases reported in over 116 countries as of 2024[1, 2]. The disease, caused by the monkeypox virus (MPXV), is endemic to Central and West Africa but has seen unprecedented spread globally since 2022, largely due to increased travel and waning immunity to orthopoxvirus [1, 3]. MPXV is categorized into two primary clades: the Central African (Congo Basin) clade, known as Clade I, and the West African clade, Clade II. Clade I, which includes subtypes Ia and Ib, exhibits higher virulence and a case-fatality ratio of up to 10%, primarily

© 2025 The author(s) and Published by the Evidence Journals. This is an open access article under the terms of the Creative Commons Attribution License, which permits use, distribution and reproduction in any medium, provided the original work is properly cited.

Download PDFBack To ArticleIntroductionMethodsResultDiscussionConclusionReferences

affecting Central African regions with significant outbreaks reported in the Democratic Republic of Congo (DRC) [4, 5]. Clade II, encompassing subtypes IIa and IIb, is less virulent but more adept at spreading globally, as evidenced during the 2022 outbreak that significantly impacted non-endemic regions [6]. This distinction underscores the need for tailored public health strategies and global cooperation, particularly following the World Health Organization's 2024 declaration of Mpox as a Public Health Emergency of International Concern (PHEIC), highlighting persistent global health challenges [7]. The first declaration of Mpox as a PHEIC in 2022, and now again in 2024, underscores a persistent pattern of failures in the global response to epidemic-prone pathogens [8]. This second declaration by the WHO on August 14, 2024, highlights ongoing challenges such as vaccine disparities and significant gaps in understanding Mpox's epidemiology, transmission, pathogenesis, and control strategies [8].

The 2022 outbreak was characterized by atypical presentations, including genital lesions and sexual transmission, particularly among men who have sex with men (MSM), highlighting new transmission dynamics [3, 9]. The WHO reported 94,707 cases and 181 deaths globally by March 2024, with the United States accounting for a significant portion of these cases [9]. As of June 2024, the WHO has reported an outbreak with nearly 100,000 confirmed cases and 200 fatalities, primarily in the DRC [10]. Neighbouring countries such as Burundi and Kenya have also been impacted [10]. Furthermore, both Sweden and Thailand have each reported one case linked to travel. As of September 24, 2024, the WHO reported that there are more than 106,000 confirmed cases and 234 deaths in 123 countries [11, 12]. Despite the availability of vaccines and antiviral treatments like tecovirimat, challenges remain in their distribution and effectiveness, particularly in non-endemic regions [1, 3]. Public health measures such as surveillance, case isolation, and targeted vaccination are crucial, yet gaps in knowledge about the virus's animal reservoirs and mutations persist [3, 13]. The recent outbreaks underscore the need for a coordinated global response, integrating public health strategies, community engagement, and interdisciplinary research to prevent future outbreaks and mitigate the impact on vulnerable populations [13, 14]. The MpoxReC aims to enhance vaccine access and regulatory processes in Africa, advocating for the use of attenuated vaccinia-based vaccines during outbreaks [15]. The global response to Mpox must prioritize equitable access to medical countermeasures and address the socio-economic factors contributing to its spread [14, 15].

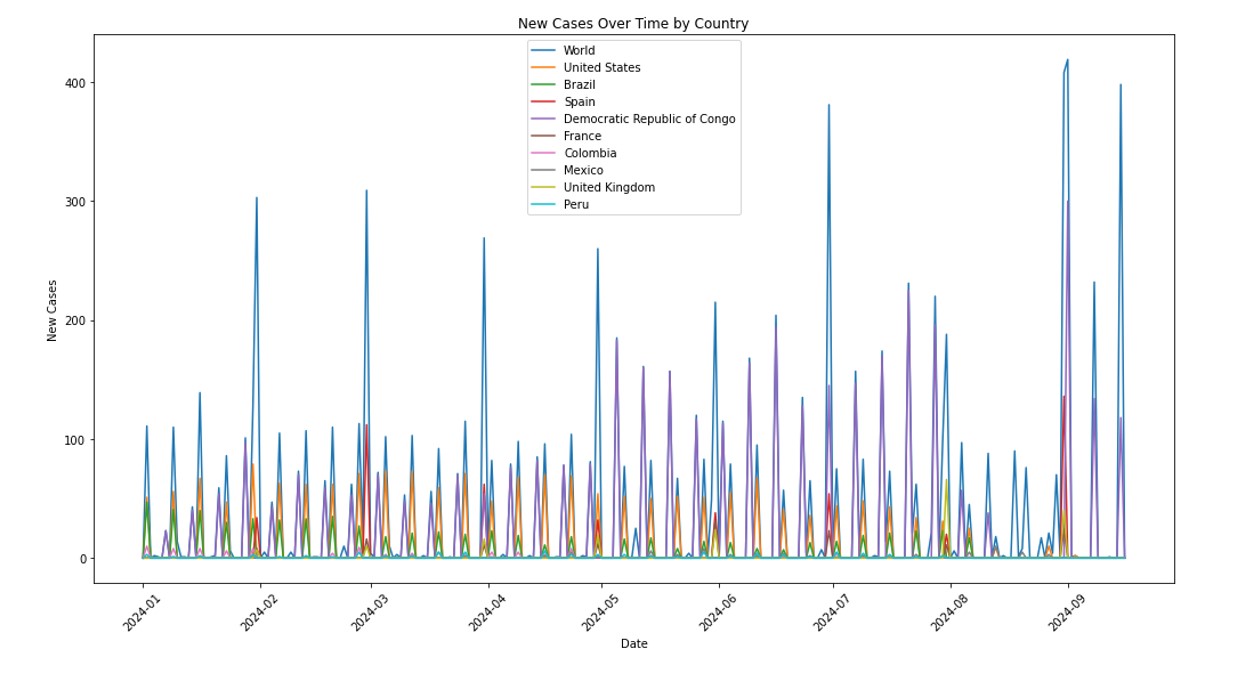
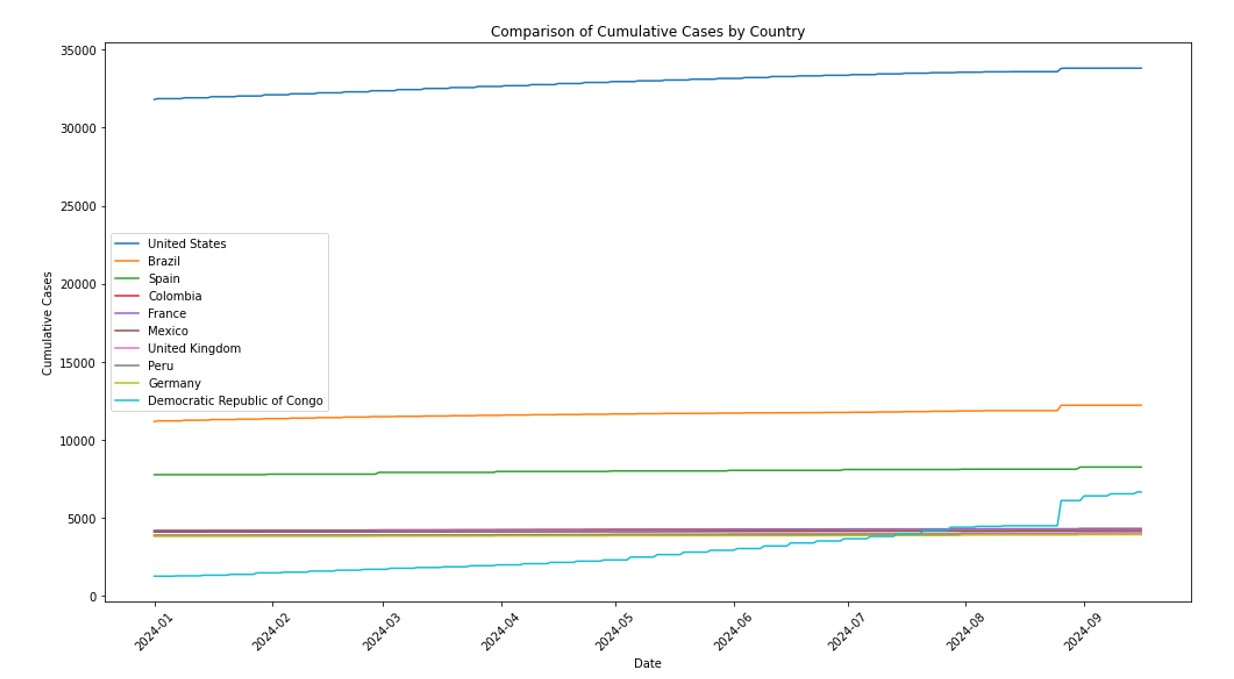
Mpox cases can be characterized as time-series data, displaying dynamic fluctuations under varying epidemic prevention and control scenarios. This variability underscores the suitability of time-series models for forecasting. The ability to predict daily new cases and total confirmed cases in the hardest-hit countries is critical from a practical perspective, as it informs effective public health decision-making and intervention strategies. Advanced methodologies like Deep learning architectures, such as Convolutional Neural Networks (CNN), Long Short-Term Memory (LSTM), and their combinations, have been employed to model the volatile and short-term data of Mpox cases, with the BaLSTM ensemble method achieving significant accuracy improvements over traditional models like ARIMA and SVM in Brazil [16]. The EpiNow2 model, used for nowcasting and forecasting in the U.S., demonstrated lower probabilistic error compared to Bayesian models, highlighting the importance of adapting models to different outbreak phases [17, 18]. Time series models like ARIMA and SARIMA have been applied to predict future Mpox cases, with SARIMA showing slightly better performance [18]. The modified SEIR model, adapted from COVID-19 predictions, has been used to simulate Mpox transmission and control scenarios, indicating the potential impact of vaccination on reducing case numbers [19]. Deterministic and stochastic models have been developed to understand Mpox dynamics, emphasizing the role of animal-to-human transmission and the basic reproduction number in managing outbreaks [20].

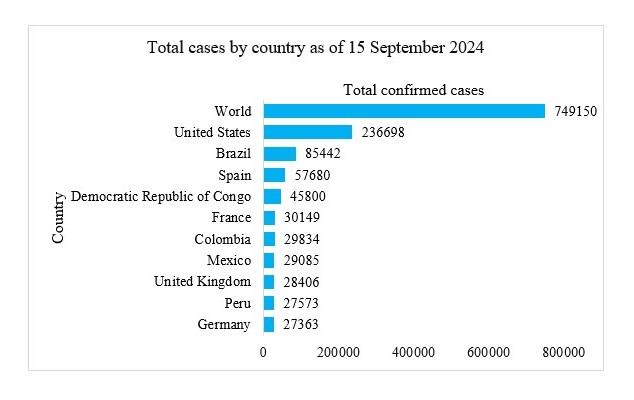
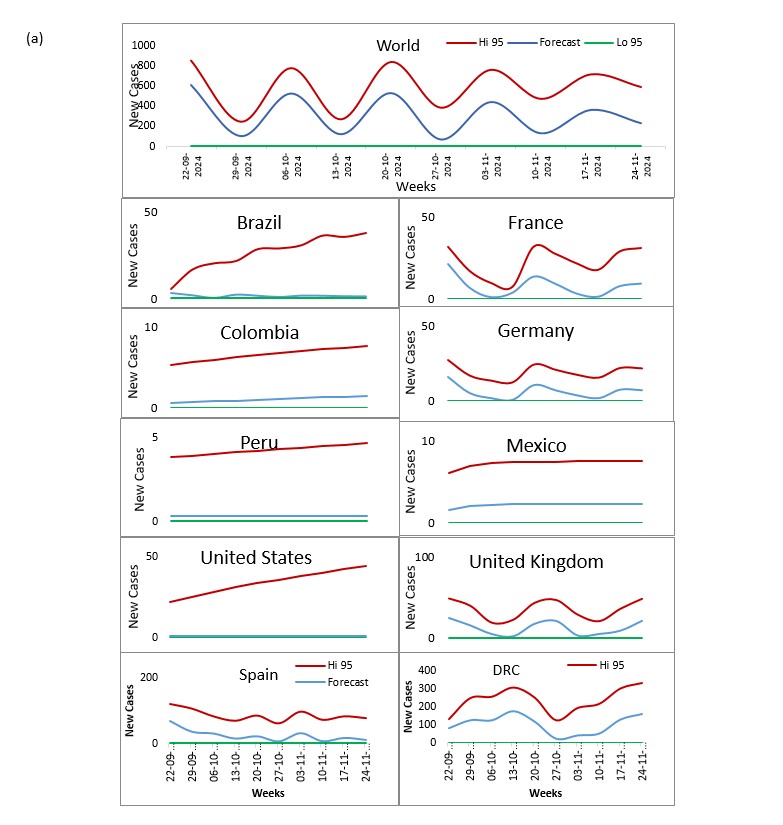
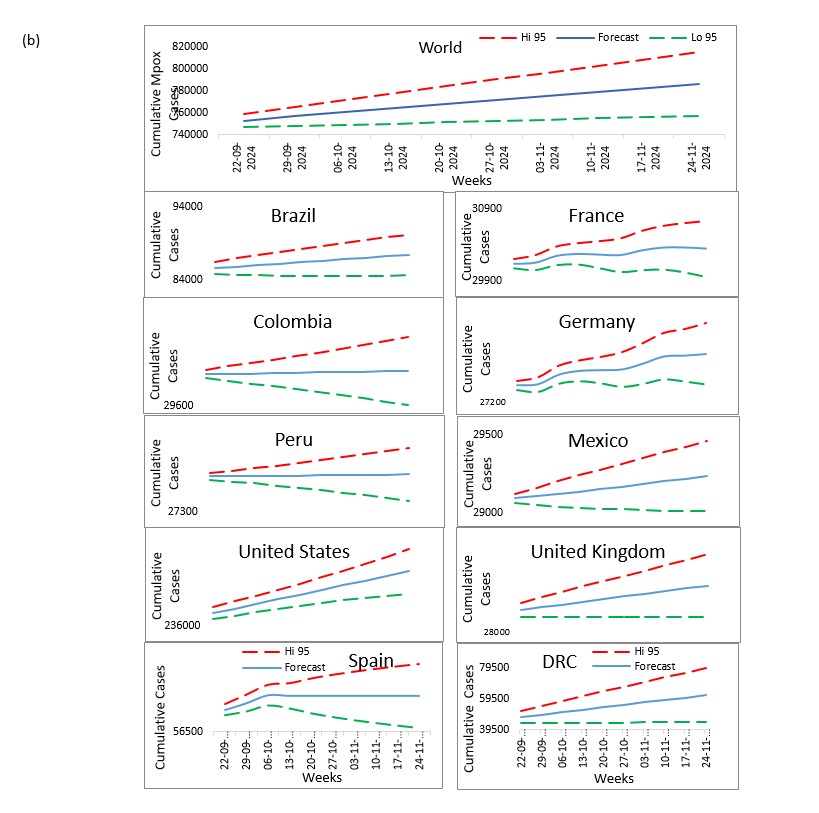
Our study aims to refine Mpox forecasting by integrating Jointpoint and ARIMA models, with a focus on accurately predicting disease trends and supporting effective public health responses. This approach combines the trend analysis capabilities of Jointpoint with the robust time-series forecasting of ARIMA to provide deeper insights into Mpox transmission dynamics. Utilizing data on daily confirmed and cumulative cases from the ten most affected countries United States, Brazil, Spain, Democratic Republic of Congo, France, Colombia, Mexico, United Kingdom, Peru, and Germany we aim to forecast the next 10 weeks.

Methods

Data Sources

The data for this study were collected from the official Our World in Data website (https://ourworldindata.org/). The dataset consisted of daily confirmed cases and cumulative cases of Mpox disease from the ten most affected countries, United States, Brazil, Spain, Democratic Republic of Congo, France, Colombia, Mexico, United Kingdom, Peru and Germany covering the period from January 1, 2024, to September 9, 2024. The data extraction process is comprehensively illustrated in Figure 1. This dataset was used to project the number of new confirmed and cumulative cases of Mpox across the included countries for a subsequent period. Forecasting was done for the next 1 months, extending the sequence from September 10, 2024, to October 5, 2024.

Join Point Regression analysis for Mpox confirmed new cases

For the analysis of new Mpox cases, join point version 5.2.0 was used to calculate the week Percent Change (WPC). The final dataset, spanning from August 02, 2023 to August 18 ,2024, was utilized to detect significant changes in trends over time. The WPC was computed for each segment identified by the model, representing the rate of change within that period, while the Average Weekly Percent Change (AWPC) provided a summary measure of the overall trend across the entire study period. These metrics offered a detailed understanding of the progression and acceleration of the Mpox outbreak during the specified timeframe.

ARIMA Model Specification, Estimation, and Testing for Mpox

Initially, the relevant data is extracted and transformed to stabilize variance and obtain a stationary series, which is crucial for time series analysis. This is often achieved by differencing the data, which removes trends and stabilizes variance. First-order differencing is usually sufficient, though sometimes second-order differencing may be needed. To statistically confirm stationarity, the Dickey-Fuller test can be used, where a low p-value indicates that the series is stationary and ready for ARIMA modelling. The next phase involves examining the data, particularly using autocorrelation functions (ACF) and partial autocorrelation functions (PACF), to identify potential models. ARIMA (p,d,q) models are particularly suited for analysing Mpox case data, as they capture trends, seasonal fluctuations, and random variations. The parameters p (autoregressive terms), d (differencing), and q (moving average terms) are determined by analysing the data's autocorrelation patterns. ARIMA (p, d, q) model can be written as:

evipubh-05-01.jpg

Where is a constant, is a white noise , is the vector of model coefficients & p and q are non-negative integer.

evipubh-05-02.jpg

Model selection is then performed based on the lowest Akaike Information Criterion (AIC) and Bayesian Information Criterion (BIC) values, ensuring the most accurate predictions.

Where is the number of parameters in the statistical model and is the maximizes value of the likelihood function foe the estimated model. Also, model selection is then performed based on various error metrics including Mean Error (ME), Root Mean Square Error (RMSE), Mean Absolute

Error (MAE), and Mean Absolute Scaled Error (MASE), ensuring the selection of an accurate and parsimonious model [21, 22]. Following this, the parameters of the selected models are estimated, and residual analysis is conducted to confirm that the residuals are white noise, using ACF/PACF checks and a portmanteau test. Once validated, the model is applied to forecast future values for next ten weeks, with the results presented in both tabular and graphical formats, providing a clear and concise prediction of future trends in the Mpox outbreak.

Result

Table 1: Descriptive statistics new mpox cases and cumulative cases in world and most affected countries

CountriesMinimumMaximumMeanStd. ErrorStd. DeviationSkewnessKurtosis
New cases
United States0796.901.1718.822.565.04
Brazil0472.700.508.003.2110.27
Spain01361.880.7812.578.2775.34
Colombia010.440.101.544.1517.82
France031.520.203.236.9952.33
Mexico010.290.071.155.2732.35
United Kingdom066.700.335.289.63104.40
Peru06.310.061.013.6313.05
Germany029.420.172.717.8969.14
Democratic Republic of Congo030014.572.7043.603.5213.28
World041938.714.6775.242.748.58
Cumulative cases
United States318093381432925.5136.907595.105-.238-1.174
Brazil111561220611649.6015.301246.717.442.223
Spain775282407971.358.524137.442-.091-.731
Colombia414842624228.881.95831.572-.727-.706
France417143074227.682.70243.566.305-1.276
Mexico407941554107.861.56225.179.547-1.081
United Kingdom387540583935.023.35654.118.878-.223
Peru385939393904.121.69527.337-.097-1.439
Germany380039093840.641.95531.520.603-.491
Democratic Republic of Congo124566442927.4090.9161465.971.964.152
World9493810736399737.34200.9203239.738.545-.420

Descriptive statistics for Mpox cases from January 1, 2024, to September 15, 2024, offer detailed insights into new and cumulative cases across various countries, capturing variability and distribution patterns. According to Table 1, the United States reports the highest maximum of new cases in a single day at 79, with an average of 6.90 cases and a standard deviation of 18.82. The Democratic Republic of Congo presents the highest average daily new cases at 14.57, reaching up to 300 new cases on the highest day. For cumulative cases, the U.S. leads with an average of 32,925.51, despite a slight negative skewness of -0.238. The Democratic Republic of Congo demonstrates significant variability with an average of 2,927.40 cumulative cases and a high standard deviation of 1465.971. These statistics from Table 1 depict a broad range of impacts from the Mpox outbreak, reflecting both severe and more controlled outbreak scenarios across different regions.

Figure 1 provides a visual representation of total Mpox cases by country as of September 15, 2024, illustrating the varying impacts of the outbreak across different regions. The United States leads with the highest number of cases, exceeding 2,36,698, highlighting a significant outbreak. Brazil and Spain follow with substantial total cases, reflecting notable outbreaks in these countries. In contrast, Germany and the Peru, despite their previously noted high daily new case counts, show relatively

lower cumulative cases in the graph, suggesting different levels of outbreak control and response effectiveness.

evipubh-05-44.jpg

Figure 1: Mpox cases in the ten most affected countries

Sources: Our World in Data website (https://ourworldindata.org/)

Figure 2 illustrates the daily new confirmed Mpox cases in ten affected countries from January 1, 2024, to September 15, 2024, highlighting significant fluctuations and peaks in cases, particularly in the United States and the Democratic Republic of Congo. Figure 3 complements this by showing cumulative confirmed Mpox cases over the same period, where the United States exhibits a steep and steady increase, maintaining a high cumulative total significantly above other countries. Both figures reveal the dynamic nature of the outbreak, with daily fluctuations evident in Figure 2 and the overall escalating burden of the disease shown in the cumulative trends of Figure 3, underscoring the varied epidemic responses and public health challenges faced by these countries.

evipubh-05-05.jpg

Figure 2: Comparison of daily new confirmed Mpox cases in most ten affected countries from January 1, 2024 to September 15, 2024

The joinpoint analysis serves as a crucial statistical method in assessing the function of WPC in new and cumulative Mpox cases from January 1, 2024, to September 15, 2024. As detailed in Figure 4, this method helps identify points where significant changes in the trend of reported cases occur, allowing for a deeper understanding of the epidemic's dynamics over time. The initial joinpoint segment reveals significant regional disparities: the United States shows a pronounced decline in new cases with a WPC of -11.84% (CI: -9.54 to -15.28), whereas the DRC experiences an alarming surge, peaking at 308.04% WPC (CI: 1301.23 to 141.85). Cumulatively, the global average increase was marked at 0.26% WPC (CI: 0.25 to 0.27), with the Democratic Republic of Congo recording a much higher rise of 3.75% WPC (CI: 1.24 to 4.24). These trends are visually articulated in supplementary Figure S1 and Table S2, which display the fluctuations and shifts in new and cumulative cases respectively, highlighting the varied impact and management of the Mpox outbreak across different regions.

Table 2: Estimation of parameters for the best fitted ARIMA model parameters and AIC, BIC of the ARIMA models for 10 countries

CountryConfirmed CasesCumulative cases
ModelsAICBICModelsAICBIC
World(4,0,2)488.81501.91(0,2,1)663.31666.42
United States(0,1,1)283.86287.08(0,2,3)489.68495.9
Brazil(4,1,2)232.92244.2(0,2,1)524.74527.85
Spain(3,1,3)362.68373.95(0,1,4)476.5484.42
Colombia(1,0,1)180.21186.76(2,1,2)302.11310.03
France(4,1,4)246.73261.22(4,1,0)359.77367.69
Mexico(1,1,1)172.19177.03(1,2,1)289.6294.26
United Kingdom(2,1,3)301.46311.12(0,2,1)403.07406.18
Peru(0,1,1)151.54154.76(0,2,1)269.97273.08
Germany(3,1,1)242.65250.71(4,2,2)335.2346.09
Democratic Republic of Congo(4,1,0)411.56419.61(2,1,1)653.29659.62

The ARIMA models for forecasting Mpox cases across various countries exhibit varying complexities and accuracies, alongside distinct error values highlighted in Tables 3 and 4 that underscore their predictive capabilities. The global ARIMA (4,0,2) model for confirmed cases, with an AIC of 488.81 and BIC of 501.91 (Table 2), and the (0,2,1) model for cumulative cases, with an AIC of 663.31 and BIC of 666.42 (Table 2), show substantial prediction reliability with ME of -1.30 and RMSE of 109.49 for confirmed cases, and an ME of 484.76 and RMSE of 2842.40 for cumulative cases (Table 2). The United States employs simpler models for confirmed (ARIMA 0,1,1) and more complex models for cumulative cases (ARIMA 0,2,3), achieving close adherence to observed data for confirmed cases with ME of -2.24 and RMSE of 10.45, but showing challenges in capturing long-term trends in cumulative cases with an ME of -16.07 and RMSE of 225.01 (Table 2). Brazil’s confirmed case model (ARIMA 4,1,2) shows high predictive accuracy with an ME of -1.04 and RMSE of 4.32 (Table 3). Similarly, Spain and France use models (ARIMA 3,1,3 and ARIMA 4,1,4, respectively) with moderate complexity and reasonable accuracy, evidenced by ME of 3.07 and RMSE of 23.20 for Spain, and ME of 0.28 and RMSE of 4.36 for France (Table 2). Models in countries like Colombia, Mexico, the United Kingdom, Peru, Germany, and the Democratic Republic of Congo vary in complexity and effectiveness, each presenting unique ME and RMSE values that reflect their specific epidemiological and data landscapes (Table 2). These models serve critical roles in understanding and predicting the spread of Mpox, although their performance metrics, including ME, RMSE, MAE, and MASE from Table 3, indicate that prediction accuracy can significantly differ across different settings.

Overall, the detailed data from these tables highlights the need for tailored ARIMA modeling approaches that cater to the specific epidemiological characteristics of each country and the global context. Further insights are provided by supplementary Figure S1 and Figure 4, which include ACF and PACF plots for cumulative Mpox cases. These figures are crucial for determining the appropriate ARIMA model orders by revealing the data dependencies at various lags. The ACF and PACF plots guide the selection of ARIMA models by displaying the decay of autocorrelations at different lags, ensuring that the selected model fits the inherent time series patterns.

evipubh-05-03.jpg

Figure 3: Comparison of daily cumulative confirmed Mpox cases in most ten affected countries from January 1, 2024 to September 15, 2024

Moreover, Figure 4 forecasts weekly new and cumulative Mpox cases for the next ten weeks using the best-fitted ARIMA models, presented with 95% Confidence Intervals. This graphical representation not only shows the projected trends but also visually encapsulates the uncertainty around these forecasts, which is essential for planning effective public health responses. By the week of October 24, 2024, the forecasts indicate Spain will experience the highest number of new cases, expecting 21, while the DRC follows with 9 new cases. France and Germany are each anticipated to report 7 new cases.

Table 3: Accuracy evaluation metrics of ARIMA models for forecasting Mpox cases

CasesCountryModel fitting summary
MERMSEMAEMASE
ConfirmedWorld-1.3109.4982.010.5
United States-2.2410.458.250.96
Brazil-1.044.323.450.94
Spain3.0723.213.950.52
Colombia-0.512.291.710.85
France0.284.362.990.4
Mexico0.342.211.60.76
United Kingdom2.0610.866.030.6
Peru-0.21.731.350.82
Germany0.955.272.780.47
Democratic Republic of Congo3.3552.0134.860.84
CumulativeWorld484.762842.41013.140.43
United States-16.07225.01122.490.32
Brazil-1.99380.82127.290.64
Spain51.93141.0992.920.97
Colombia-1.7714.210.70.52
France7.5829.7120.660.78
Mexico1.3714.8710.790.73
United Kingdom12.6569.0341.351.16
Peru-1.3112.169.340.62
Germany2.4722.0513.810.65
Democratic Republic of Congo466.141836.02620.470.6

In contrast, Brazil, Colombia, the United Kingdom, and the United States are each forecasted to have only 1 new case, with Mexico and Peru expected to report no new cases. Regarding cumulative cases, the United Kingdom and the United States are projected to have the highest burdens with 240,119 and 239,976 cases respectively, demonstrating the intense impact of the outbreak in these regions.Brazil's cumulative cases are expected to reach 87,405, followed by the DRC with 61,867 cases. Other countries like France, Germany, Mexico, Peru, and Spain are forecasted to have lower cumulative totals, ranging from 27,591 to 30,445 cases. These forecasts highlight the varied public health challenges faced by each country and underscore the necessity for precise epidemiological forecasting behaviour of the Mpox outbreak.

Discussion

Mpox poses a significant public health challenge, and in addressing this problem, a comprehensive epidemiological study employed joinpoint regression and ARIMA forecasting models to analyze temporal and regional disparities in the epidemic's progression. The joinpoint analysis meticulously identified critical junctures where trends in new and cumulative Mpox cases underwent significant shifts, highlighting the varied impacts and public health responses across different regions. This analysis notably revealed a sharp escalation of cases in the Democratic Republic of Congo versus more moderated trends elsewhere. Subsequently, ARIMA forecasting offered valuable predictions, suggesting an impending slowdown in new Mpox case numbers globally, though cumulative incidences are expected to continue rising. This indicates that while immediate transmission rates may be abating due to robust public health interventions, the overall disease burden remains on an upward trajectory. Insights derived from ACF and PACF plots, alongside detailed predictive figures, provide essential guidance for ongoing and future public health strategies, emphasizing the necessity for sustained efforts to control and ultimately reduce the Mpox outbreak.

The forecasting of the Mpox epidemic has been a critical area of research, employing various models to predict its trajectory and inform public health interventions. The modified SEIR model, initially developed for COVID-19, has been adapted to predict Mpox cases, achieving a relative error of 15% in global predictions and 20% in specific countries like the United States and Brazil [23]. Machine learning approaches, such as ARIMA, NNETAR, and ETS, have also been utilized, with ARIMA showing the lowest mean absolute percentage error in France, while NNETAR excelled in Spain, the UK, and the USA [24]. The EpiNow2 model, used for nowcasting and forecasting in the U.S., demonstrated less probabilistic error compared to a naive Bayesian GLM, except in the early outbreak phase [17]. The EpiSIX system predicted that the global Mpox epidemic would enter a low epidemic status by March 2023, with a basic reproduction number (R0) of approximately 3.1, similar to SARS [25]. Ensemble sub-epidemic frameworks have outperformed traditional models like ARIMA in short-term forecasts, suggesting their efficacy in emerging infectious disease scenarios [26]. Stochastic models, including the multilayer perceptron (MLP), have shown superior performance over ARIMA, indicating the potential of machine learning in epidemic forecasting [24]. Overall, the integration of various modeling approaches, including machine learning and traditional time series models, has enhanced the accuracy and reliability of Mpox forecasts, providing valuable insights for public health decision-making and highlighting the importance of adaptive and robust forecasting frameworks in managing infectious disease outbreaks [26, 27].

The United States is consistently predicted to be the hardest-hit country, with forecasts indicating an average of 58 cases per day, highlighting the need for robust health surveillance strategies [28]. Brazil follows with an expected average of 23 cases per day, while Spain and France also face substantial burdens with forecasts of 52 and 24 cases per day, respectively [28]. The global prediction models, such as the modified SEIR model, suggest that the epidemic will spread to nearly all countries, with the United States, Brazil, Germany, France, and the United Kingdom being the most affected, with case numbers reaching into the tens of thousands [19, 23]. The use of various forecasting models, including ARIMA, GAM, and ensemble sub-epidemic frameworks, has been critical in guiding public health interventions. The spatial-wave and n-sub-epidemic models have shown superior performance in terms of mean squared error and prediction interval coverage, suggesting their efficacy in short-term epidemic forecasting [26, 29]. Despite the initial surge, recent forecasts indicate a plateauing or declining trend in cases, attributed to increased immunity and behavioural changes among high-risk populations [27]. The Gompertz model has been identified as providing a better fit for actual data, particularly in estimating contagion rates

and basic reproduction numbers, which are crucial for understanding the epidemic's dynamics across different regions [30]. Overall, these forecasting efforts underscore the importance of adaptive public health strategies and the potential impact of vaccination and behavioural interventions in mitigating the spread of Mpox globally.

The global response to the Mpox outbreak, has necessitated a comprehensive programmatic policy to address its spread and impact. The 2022 outbreak marked a significant shift in the epidemiology of Mpox, with cases emerging outside of Africa in non-endemic regions such as Europe, the Americas, and Australia, primarily affecting young men who have sex with men (MSM) [31]. The WHO declared it a Public Health Emergency of International Concern, highlighting the need for urgent global action [32]. The primary mode of transmission during this outbreak was through intimate contact, particularly sexual contact, leading to its classification as a sexually transmitted disease [9]. This classification has been pivotal in shaping public health interventions, including targeted vaccination campaigns, testing, and educational programs aimed at reducing exposure and transmission among high-risk groups [33]. The outbreak has also underscored the importance of addressing stigma and ensuring equitable access to healthcare resources for affected populations, particularly MSM and people living with HIV, who are disproportionately impacted [9]. Furthermore, the development of a comprehensive Mpox Knowledge Graph has facilitated the integration of biological and chemical data, enhancing our understanding of the virus and informing future research and policy decisions [34]. Overall, the global response to Mpox has involved a multifaceted approach, combining vaccination, public health education, and ongoing research to mitigate the threat of this re-emerging zoonotic disease [35].

evipubh-05-06a.jpg

evipubh-05-06b.jpg

Figure 4: Prediction of best fitted ARIMA model (95% CI) for the weekly new Mpox cases(a) weekly cumulative Mpox cases(b) (for the next 10 weeks) from September 22, 2024 to October 24 2024

In evaluating the strengths and limitations of our study, several points stand out. One significant strength is the use of sophisticated statistical models like joinpoint regression and ARIMA forecasting, which have enabled a nuanced analysis of trends and predictions that are crucial for effective public health planning. Our study's ability to identify critical junctures and forecast future trends provides valuable insights that can guide more informed and targeted interventions. However, the study also has limitations that must be acknowledged. The accuracy of our forecasts relies heavily on the quality and completeness of the data available, which can vary significantly between regions. Data limitations, particularly in under-reported regions or countries with limited surveillance capabilities, may affect the generalizability and accuracy of our findings. Additionally, while our models account for current trends, they may not fully capture sudden changes in the epidemiology of the disease due to new virus strains or shifts in public health policies.

Conclusion

Our study's application of joinpoint regression and ARIMA forecasting models provides essential insights into the Mpox epidemic's dynamics, highlighting critical temporal and geographical variations in case trends. These sophisticated statistical tools have enabled accurate predictions of the outbreak’s trajectory, informing targeted public health responses. The results underscore the necessity of adaptive and data-driven strategies in managing epidemics, emphasizing the crucial role of ongoing surveillance and modelling in enhancing public health interventions and policies. This comprehensive approach aids in effectively addressing the challenges posed by Mpox, contributing significantly to global health security and epidemic preparedness.

Abbreviations

Mpox: Monkeypox

DCR: Democratic Republic of the Congo

MSM: Sex with men

ACF: Autocorrelation function

AIC: Akaike Information Criterion

AR: Autoregressive

ARIMA: Autoregressive Integrated Moving Average

BIC: Bayesian Information Criterion

Supporting information: None

Ethical Considerations: This study employed data from the publicly accessible GBD Study 2021, presented by the Institute for Health Metrics and Evaluation (IHME), the Indian Council of Medical Research (ICMR), and the Public Health Foundation of India (PHFI). The dataset was meticulously compiled and anonymized to eliminate any personally identifiable information, thereby eliminating the requirement for ethical approval and informed consent.

Acknowledgments: The authors acknowledge the Global Burden of Disease Study 2021 for providing the data.

Funding: This research received no specific grant from any funding agency in the public, commercial, or not-for-profit sectors.

Author contribution statement: All authors (AM, PP, SB, SC) contributed equally and attest they meet the ICMJE criteria for authorship and gave final approval for submission

Data availability statement: Data used in this study is manuscript available at (https://vizhub.healthdata.org/gbd-results/).

Additional information: No additional information is available for this paper.

Declaration of competing interest: The authors declared no potential conflicts of interest with respect to the research, authorship, and/or publication of this article.

Clinical Trial: Not applicable

Consent for publication: Note applicable

References

[1] Memariani M, Memariani H. Global Re-emergence of Monkeypox: A Synoptic Review. Ibnosina Journal of Medicine and Biomedical Sciences. 2024;16(02): 049-056. [Crossref][PubMed][Google Scholar]

[2] Mitjà O, Ogoina D, Titanji BK, Galvan C, Muyembe J-J, Marks M, et al. Monkeypox. The Lancet. 2023;401(10370):60-74. [Crossref][PubMed][Google Scholar]

[3] Anil S, Joseph B, Thomas M, Sweety VK, Suresh N, Waltimo T. Monkeypox: A Viral Zoonotic Disease of Rising Global Concern. Infectious Diseases & Immunity. 2024;4(03):121-31. [Crossref][PubMed][Google Scholar]

[4] Andrei G, Snoeck R. Differences in pathogenicity among the Mpox virus clades: impact on drug discovery and vaccine development. Trends in Pharmacological Sciences. 2023;44(10):719-739. [Crossref][PubMed][Google Scholar]

[5] Nolen LD, Osadebe L, Katomba J, Likofata J, Mukadi D, Monroe B, et al. Extended human-to-human transmission during a monkeypox outbreak in the Democratic Republic of the Congo. Emerging infectious diseases. 2016;22(6):1014. [Crossref][PubMed][Google Scholar]

[6] Kraemer MU, Tegally H, Pigott DM, Dasgupta A, Sheldon J, Wilkinson E, et al. Tracking the 2022 monkeypox outbreak with epidemiological data in real-time. The Lancet Infectious Diseases. 2022;22(7):941-2. [Crossref][PubMed][Google Scholar]

[7] Acosta-Espana JD, Bonilla-Aldana DK, Luna C, Rodriguez-Morales AJ. The Resurgence of Mpox: A New Global Health Crisis. Infez Med. 2024;32(3):267-71. [Crossref][PubMed][Google Scholar]

[8] Organization WH. WHO Director-General declares Mpox outbreak a public health emergency of international concern [Internet]. 2024. [cited on 2024 Dec 17]. Available from: [Article][Crossref][PubMed][Google Scholar]

[9] Acharya A, Kumar N, Singh K, Byrareddy SN. Mpox in MSM: Tackling Stigma, Minimizing Risk Factors, Exploring Pathogenesis, and Treatment Approaches. Biomedical Journal. 2024:100746. [Crossref][PubMed][Google Scholar]

[10] Anderer S. WHO Announces Mpox Global Plan, Appeals for Funding. JAMA. 2024;332(15):1228. [Crossref][PubMed][Google Scholar]

[11] Cordeiro R, Caetano CP, Sobral D, Ferreira R, Coelho L, Pelerito A, et al. Viral genetics and transmission dynamics in the second wave of Mpox outbreak in Portugal and forecasting public health scenarios. Emerg Microbes Infect. 2024;13(1):2412635. [Crossref][PubMed][Google Scholar]

[12] WHO. 2022-23 Mpox (Monkeypox) Outbreak: Global Trends. World Health Organization. 2023. [Crossref][PubMed][Google Scholar]

[13] Anwar F, Haq I, Ahmad R, Shahab M, Ullah A, Tong Y. Monkeypox: A Timely Update on the Global Outbreak, Transmission, Viral Replication, Vaccination and Clinical Strategies. Supramolecular Materials. 2024:100071. [Crossref][PubMed][Google Scholar]

[14] Sheek-Hussein M, Alsuwaidi AR, Davies EA, Abu-Zidan FM. Monkeypox: A current emergency global health threat. Turkish Journal of Emergency Medicine. 2023;23(1):5-16. [Crossref][PubMed][Google Scholar]

[15] Nachega JB, Sam-Agudu NA, Ogoina D, Mbala-Kingebeni P, Ntoumi F, Nakouné E, et al. The surge of Mpox in Africa: a call for action. The Lancet Global Health. 2024. [Crossref][PubMed][Google Scholar]

[16] Soto-Ferrari M, Carrasco-Pena A, Prieto D. Deep Learning Architectures Framework for Emerging Outbreak Forecasting of Mpox: A Bagged Ensemble Scheme to Model Accurate Prediction Intervals. 2023. . [Crossref][PubMed][Google Scholar]

[17] Charniga K, Madewell ZJ, Masters NB, Asher J, Nakazawa Y, Spicknall IH. Nowcasting and forecasting the 2022 US Mpox outbreak: support for public health decision making and lessons learned. Epidemics. 2024;47:100755. [Crossref][PubMed][Google Scholar]

[18] Pramanik A, Sultana S, Rahman MS, editors. Time series analysis and forecasting of Monkeypox disease using ARIMA and SARIMA model. 2022 13th International Conference on Computing Communication and Networking Technologies (ICCCNT); 2022: IEEE. . [Crossref][PubMed][Google Scholar]

[19] Zhang L, Huang J, Yan W, Zhao Y, Wang D, Chen B. Global prediction for Mpox epidemic. Environmental Research. 2024;243:117748. [Crossref][PubMed][Google Scholar]

[20] Collins OC, Duffy KJ. Dynamics and control of Mpox disease using two modelling approaches. Modeling Earth Systems and Environment. 2024;10(2):1657-69. [Crossref][PubMed][Google Scholar]

[21] Abdelaziz M, Ahmed A, Riad A, Abderrezak G, Djida AA. Forecasting daily confirmed COVID-19 cases in Algeria using ARIMA models. East Mediterr Health J. 2023;29(7):515-9. [Crossref][PubMed][Google Scholar]

[22] Munir T, Khan M, Cheema SA, Khan F, Usmani A, Nazir M. Time series analysis and short-term forecasting of monkeypox outbreak trends in the 10 major affected countries. BMC Infect Dis. 2024;24(1):16. [Crossref][PubMed][Google Scholar]

[23] Zhang L, Huang J, Chen B, Zhao Y, Wang D, Yan W. Global prediction for monkeypox epidemic. medRxiv. 2022:2022. 10. 21.22280978 [Crossref][PubMed][Google Scholar]

[24] Akinola S, Wang Q, Olukanmi P, Marwala T. Early prediction of monkeypox virus outbreak using machine learning. IETI Trans Data Anal Forecast. 2023;1(2):14-29. [Crossref][PubMed][Google Scholar]

[25] Wei F, Peng Z, Jin Z, Wang J, Xu X, Zhang X, et al. Study and prediction of the 2022 global monkeypox epidemic. Journal of biosafety and biosecurity. 2022;4(2):158-62. [Crossref][PubMed][Google Scholar]

[26] Bleichrodt A, Luo R, Kirpich A, Chowell G. Evaluating the forecasting performance of ensemble sub-epidemic frameworks and other time series models for the 2022–2023 Mpox epidemic. Royal Society Open Science. 2024;11(7):240248. [Crossref][PubMed][Google Scholar]

[27] Bleichrodt A, Dahal S, Maloney K, Casanova L, Luo R, Chowell G. Real-time forecasting the trajectory of monkeypox outbreaks at the national and global levels, July–October 2022. BMC medicine. 2023;21(1):19. [Crossref][PubMed][Google Scholar]

[28] Munir T, Khan M, Cheema SA, Khan F, Usmani A, Nazir M. Time series analysis and short-term forecasting of monkeypox outbreak trends in the 10 major affected countries. BMC Infectious Diseases. 2024;24(1):16. [Crossref][PubMed][Google Scholar]

[29] Bleichrodt A, Luo R, Kirpich A, Chowell G. Retrospective evaluation of short-term forecast performance of ensemble sub-epidemic frameworks and other time-series models: The 2022-2023 Mpox outbreak across multiple geographical scales, July 14th, 2022, through February 26th, 2023. medRxiv. 2023. [Crossref][PubMed][Google Scholar]

[30] Marín-Sánchez O, Pesantes-Grados P, Pérez-Timaná L, Marín-Machuca O, Sánchez-Llatas CJ, Chacón RD. Comparative epidemiological assessment of monkeypox infections on a global and continental scale using logistic and gompertz mathematical models. Vaccines. 2023;11(12):1765. [Crossref][PubMed][Google Scholar]

[31] Rana J, Patel SK, Agrawal A, Channabasappa NK, Niranjan AK, Das BC, et al. Mpox vaccination in global perspective: Priorities and challenges. Annals of Medicine and Surgery. 2023;85(5):2243-6. [Crossref][PubMed][Google Scholar]

[32] Jafari K, Woodward GA. Mpox. Pediatric Emergency Care. 2023;39(11):883-9. [Crossref][PubMed][Google Scholar]

[33] Allan-Blitz L-T, Gandhi M, Adamson P, Park I, Bolan G, Klausner JD. A position statement on Mpox as a sexually transmitted disease. Clinical Infectious Diseases. 2023;76(8):1508-12. [Crossref][PubMed][Google Scholar]

[34] Karki R, Gadiya Y, Zaliani A, Gribbon P. Mpox Knowledge Graph: a comprehensive representation embedding chemical entities and associated biology of Mpox. Bioinformatics Advances. 2023;3(1):vbad045. [Crossref][PubMed][Google Scholar]

[35] McLean J, Gunaratne S, Zucker J. Update on Mpox: What the Primary Care Clinician Should Know. Medical Clinics. 2024;108(2):355-71. [Crossref][PubMed][Google Scholar]

Disclaimer / Publisher’s NoteThe statements, opinions and data contained in all publications are solely those of the individual author(s) and contributor(s) and not of Journals and/or the editor(s). Journals and/or the editor(s) disclaim responsibility for any injury to people or property resulting from any ideas, methods, instructions or products referred to in the content.