Evidence Public Health
Vol. 1 No. 1 (2025)
Research Article Public Health
www.evidencejournals.com
Cite this Article
Jena A, Rajeev J, Lamba D S, Shilpa DM, Singla P. Burden and trends of nutritional deficiencies among reproductive-age women in India (1990–2021): implications for sustainable public health strategies from the Global Burden of Disease Study 2021. Evidence Public Health. 2025:1(1):1-18. DOI:10.61505/evipubh.2025.1.1.4
Available From
https://eph.evidencejournals.com/index.php/j/article/view/4/

Received: 2024-12-15
Revised: 2025-01-02
Accepted: 2025-01-12
Published: 2025-01-25

Evidence in Context

• Nutritional deficiencies among reproductive-age women in India declined significantly (60.51% incidence, 85.51% mortality) from 1990 to 2021.
• Regional disparities persist, with northern states like Uttar Pradesh and Bihar bearing higher burdens.
• Protein-energy malnutrition remains the largest contributor to health impacts.

• ARIMA forecasts continued improvement by 2030.
• Sustained public health efforts are essential to address residual challenges.

To view Article

Burden and trends of nutritional deficiencies among reproductive-age women in India (1990–2021): implications for sustainable public health strategies from the Global Burden of Disease Study 2021

Ashutosh Jena1, Jayalakshmi Rajeev2, Divjot Singh Lamba3, Shilpa DM4, Priyanka Singla5*

1 Department of Statistics, Utkal University, Bhubaneswar, India.

2 Department of Public Health and Community Medicine, University of Kerala, Kasaragod, India.

3 Department of Transfusion Medicine, Post Graduate Institute of Medical Education and Research, Chandigarh, India.

4 School of Public Health, JSS Academy of Higher Education and Research, Mysore, India.

5 Department of Community Medicine, MMIMSR, Mullana India.

*Correspondence:

Abstract

Background: Nutritional deficiencies are a significant public health issue among reproductive-age women in India, despite numerous interventions. This study aims to quantify trends and predict future patterns of these deficiencies from 1990 to 2021 using sophisticated Estimated Annual Percentage Change (EAPC) and ARIMA models.

Methods: Utilizing secondary data from the Global Burden of Disease (GBD) 2021 study, we applied age-standardized rates for an in-depth analysis. The approach included EAPC, joinpoint regression analysis and ARIMA forecasting to identify trends and anticipate future scenarios of nutritional deficiencies among reproductive-age women in India.

Results: Our findings show a notable overall decline in the incidence of nutritional deficiencies, with an EAPC of -3.07% (95% CI: -3.25% to -2.89%). APC analysis revealed a significant decreasing trend with a segment-specific APC of -2.08% (95% CI: -2.19% to -1.97%). ARIMA projections indicate a continued reduction in incidence rates, forecasting a drop to 4,162.75 per 100,000 by 2030 (95% CI: 3,028.81–5,296.69).

Conclusion: The results underscore the impact of ongoing public health initiatives and highlight the need for sustained policy efforts and resource allocation to further mitigate nutritional deficiencies in reproductive-age women in India.

Keywords: Nutritional deficiencies, women of reproductive age, India, Global Burden of Disease, ARIMA, Sustainable Development Goals

Introduction

Nutritional deficiencies remain a significant public health challenge, particularly among reproductive-age women, who are more vulnerable to the detrimental effects of poor nutrition. In India, where malnutrition coexists with rapid economic growth and demographic changes, addressing these deficiencies is critical to improving maternal health, childbearing outcomes, and long-term well-being. From 1990 to 2021, India has faced a persistent burden of nutritional deficiencies, including iron,

© 2025 The author(s) and Published by the Evidence Journals. This is an open access article under the terms of the Creative Commons Attribution License, which permits use, distribution and reproduction in any medium, provided the original work is properly cited.

Download PDFBack To ArticleIntroductionMethodsResultsDiscussionConclusionReferences

vitamin A and iodine deficiencies, which contribute to a range of adverse health outcomes, including anemia, stunting, and impaired cognitive development in children.

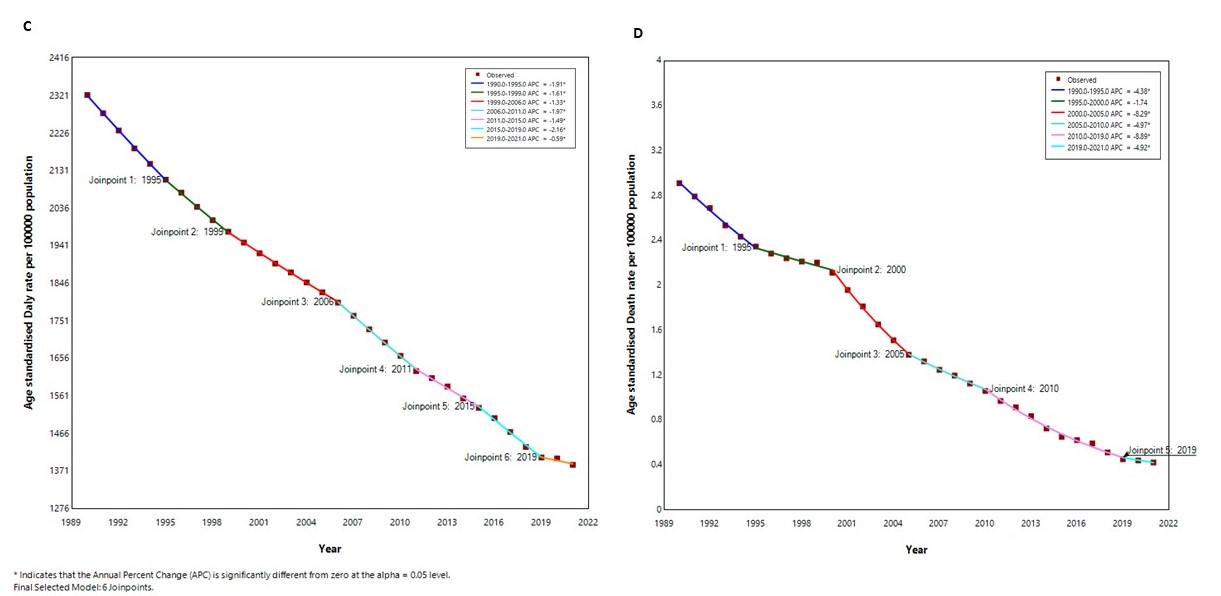
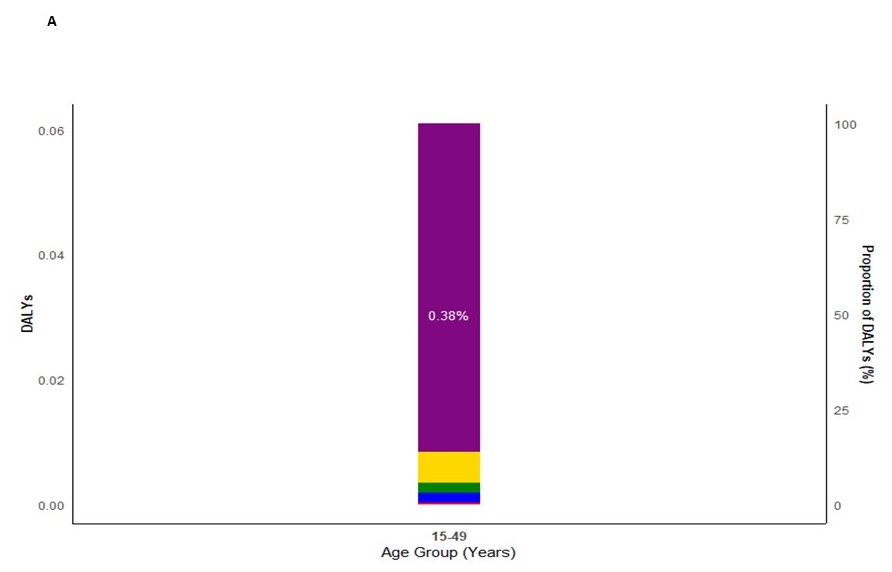
Nutritional deficiencies among reproductive-age women in India present a significant public health challenge, with anemia being one of the most prevalent issues. Anemia affects a substantial portion of this demographic, particularly pregnant and lactating women, due to inadequate dietary intake and high energy demands from work and childbearing responsibilities [1]. Malnutrition in India is multifaceted, encompassing undernutrition, micronutrient deficiencies, and overnutrition, with nearly one-third of women aged 15-49 years being underweight [2, 3]. The socio-economic factors contributing to these deficiencies include poverty, lack of education, and inadequate access to healthcare and nutrition services [2, 3]. Urban areas also exhibit significant nutritional disparities, with the poorest women experiencing higher rates of maternal thinness and anemia compared to their wealthier counterparts [4]. Despite India's economic growth, the distribution of resources remains uneven, exacerbating these nutritional challenges. The consequences of these deficiencies are profound, affecting women's reproductive health, economic productivity, and overall well-being [5]. Addressing these issues requires a multisectoral approach, including improved agricultural productivity, better food distribution systems, and enhanced public health initiatives focused on nutrition education and supplementation [3, 6]. Additionally, targeted interventions such as food fortification and the provision of iodized salt and iron supplements are crucial to mitigating these deficiencies and improving the health outcomes of women in this age group [6]. This study leverages data from the Global Burden of Disease (GBD) Study 2021 to estimate the burden and trends of nutritional deficiencies among reproductive-age women in India. The GBD database provides a comprehensive, age-standardized analysis of disease burden, offering valuable insights into temporal shifts in prevalence and associated disability-adjusted life years (DALYs) from 1990 to 2021. These trends are critical for understanding the evolving epidemiology of nutritional deficiencies in India, a country with diverse socio-economic and geographic contexts.

Despite improvements in nutrition and health interventions, such as fortified foods and maternal supplementation programs, the burden of nutritional deficiencies has remained stubbornly high. This study aims to provide evidence to inform policy, prioritize interventions, and drive progress towards achieving better health outcomes for women in India, with a focus on sustainable, long-term solutions. Additionally, this research directly contributes to Sustainable Development Goal 2 (SDG 2), specifically targeting the end of all forms of malnutrition by 2030, as outlined by the United Nations. It emphasizes the importance of tailored public health strategies to meet these global nutritional targets effectively.

Methods

Data source

The data analyzed and presented in this study comes from the GBD 2021 public datasets, which are accessible at (http://ghdx.healthdata.org/gbd-results/). The GBD 2021 study incorporates the most recent and comprehensive epidemiological data, applying standardized methods to assess the global burden of health loss and its associated risk factors for a wide range of diseases and conditions. It evaluates 358 causes of death, 364 causes of years lived with disability (YLDs), and 373 causes of DALYs across 204 countries and territories from 1990 to 2021. The GBD methodology integrates data from various sources, including national censuses, household surveys, civil registration and vital statistics, health service utilization data, disease registries, satellite imagery, and air pollution monitors. These datasets are harmonized using advanced statistical techniques to provide consistent and comparable estimates of health outcomes globally. Further details of the GBD 2021 methodology are available in the published literature [7].

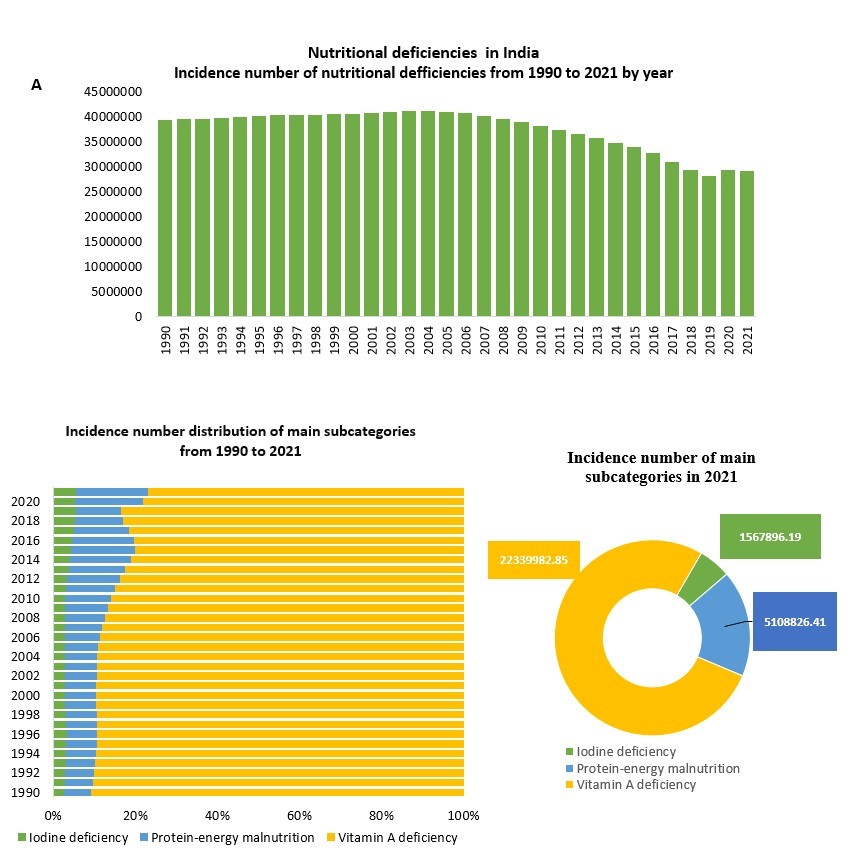
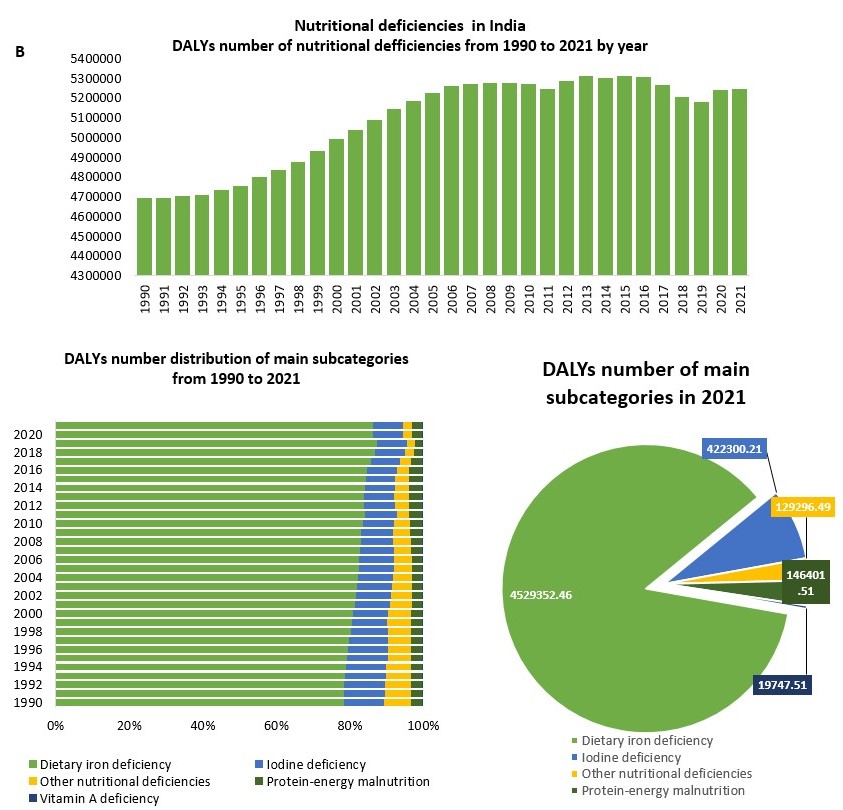
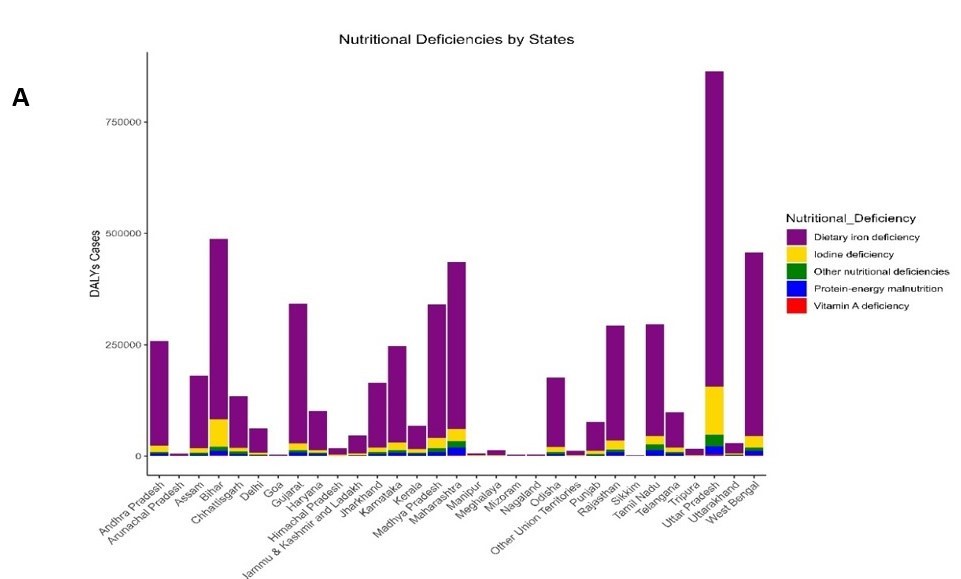
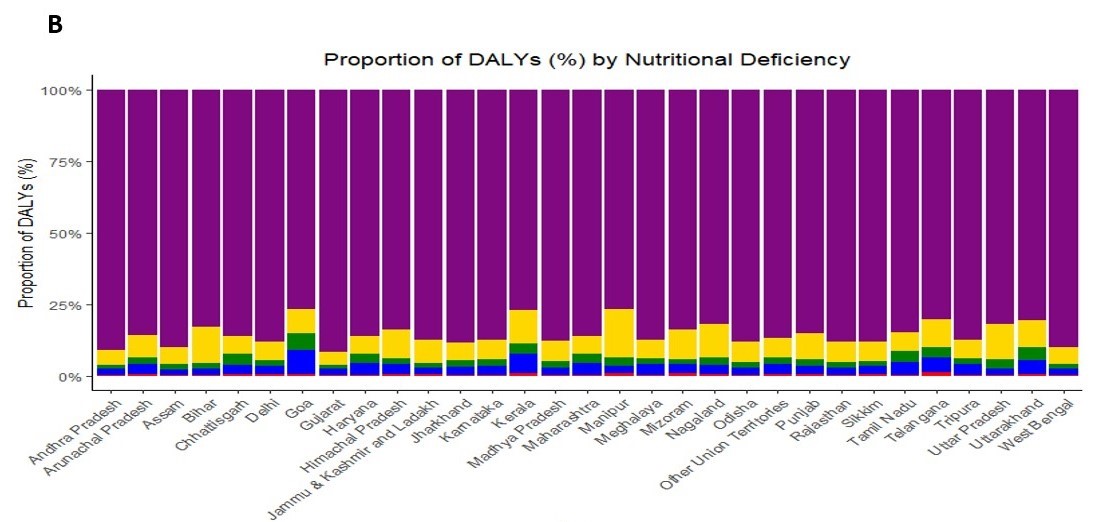
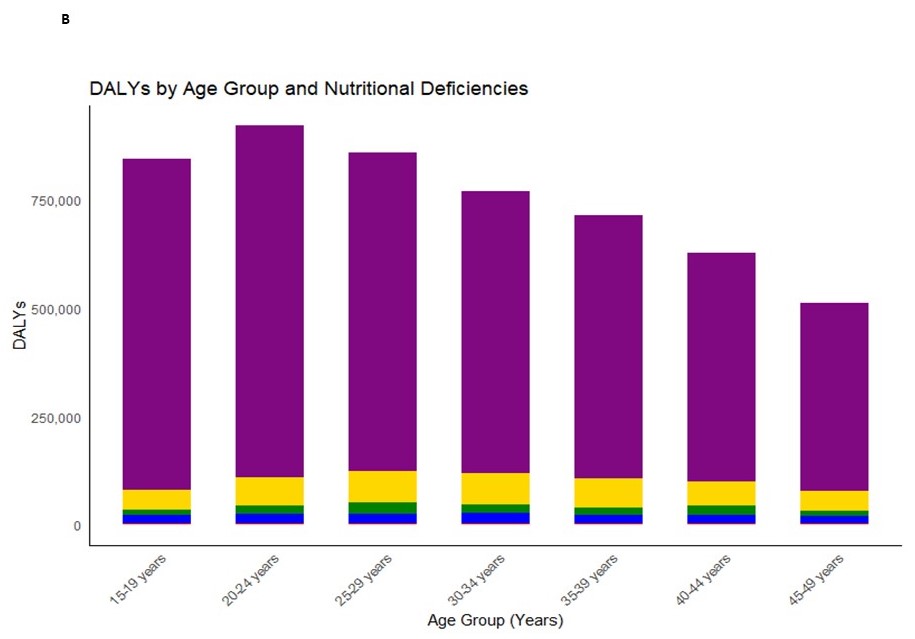
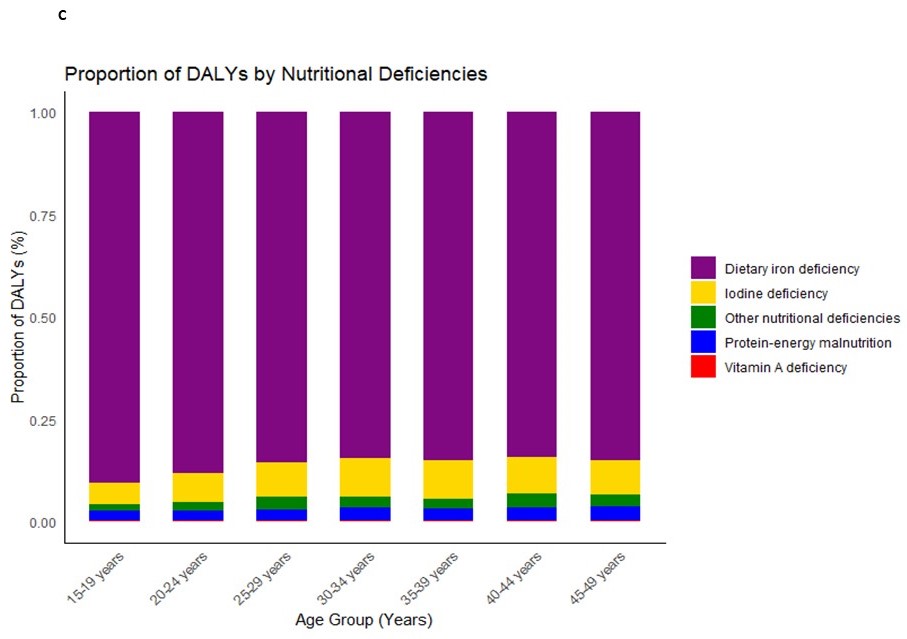
Nutritional deficiencies were categorized according to the 10th revision of the International Classification of Diseases (ICD-10), with relevant codes including D50–D53.9, E00–E02, E40–E46.9, E50–E61.9, E63–E64.9, and Z13.2–Z13.3. These deficiencies were further classified into key subgroups: protein-energy malnutrition (E40–E46.9, E64.0), iodine deficiencies (E00–E02), vitamin A deficiency (E50–E50.9, E64.1), dietary iron deficiencies (D50–D50.9), and other nutrient deficiencies (D51–D53.9, E51–E61.9, E63–E64, E64.2–E64.9).

The GBD 2021 study defines the Socio-Demographic Index (SDI) as a composite measure that ranges from 0 to 1, incorporating factors such as average income per capita, education levels, and fertility rates. A value of 0 indicates the lowest level of development in relation to health outcomes, while a value of 1 signifies the highest. Based on SDI scores, countries are classified into five categories: low (SDI < 0.45), low-middle (SDI ≥ 0.45 and < 0.61), middle (SDI ≥ 0.61 and < 0.69), high-middle (SDI ≥ 0.69 and < 0.80), and high (SDI ≥ 0.80). Furthermore, countries and territories are grouped into 21 regions based on their epidemiological similarities and geographical proximity[8]. For this study, we utilized both the absolute numbers and age-standardized rates of nutritional deficiencies among reproductive-age women (15–49 years). The age-standardized incidence rate (ASIR) represents the number of new cases per 100,000 persons, while the age-standardized DALY rate (ASR DALY) reflects the YLDs and years of life lost (YLLs) per 100,000 persons after age standardization.

Statistical analysis

The estimated annual percentage change (EAPC), which serves as an indicator of the trend in ASRs, was calculated using the following formula:

epubh-07-08.jpg

Here, denotes the calendar year, indicates the yearly change, and represents the error term. The EAPC is calculated as , based on the assumption that the ASR follows a normal distribution in its logarithmic transformation. The 95% confidence interval (CI) for the EAPC was calculated, and the standard error was obtained from the fitted regression model. If both the EAPC estimate and the lower boundary of the 95% CI were greater than 0, the ASR was considered to show an increasing trend. Conversely, if both the EAPC estimate and the upper boundary of the 95% CI were less than 0, the ASR was deemed to exhibit a decreasing trend. If the EAPC estimate and the corresponding 95% CI did not indicate a clear upward or downward trend, the ASR was considered stable over time. Additionally, the Pearson correlation analysis was utilized to explore the correlation between EAPC and SDI and ASR DALYs at a state level.

Joinpoint regression method

Joinpoint regression analysis was used to identify significant changes in the trend of ASRs of nutritional deficiencies over time. The Joinpoint model detects points where the trend in the data changes direction (i.e., "joinpoints"), allowing for the estimation of different linear segments within the data. This method helps determine the number of segments that best fit the data and provides a statistically significant assessment of trends. The software calculates the Annual Percent Change (APC) for each segment, which is the rate of change in each identified trend segment.

The average annual percentage change (AAPC) is then derived by calculating a weighted average of the APCs, which reflects the overall rate of change across the entire study period [9]. Joinpoint analysis was conducted using the Joinpoint Regression Program (version 4.9.1.0, National Cancer Institute, USA).

ARIMA (Auto Regressive Integrated Moving Average) method

To forecast future trends in nutritional deficiencies, we employed the ARIMA model, which is widely used for time series forecasting[10]. ARIMA models consist of three components: autoregressive (AR), differencing (I), and moving average (MA). The AR component models the relationship between an observation and a specified number of lagged observations, while the I component represents the number of differencing steps required to make the time series stationary. The MA component captures the dependency between an observation and a residual error from a moving average model applied to lagged observations.

The ARIMA model was fitted using the auto.arima() function in R (version 4.4.1), which automatically selects the optimal parameters (p, d, q) based on the AIC (Akaike Information Criterion). This approach was used to predict future values of age-standardized incidence rates and DALY rates related to nutritional deficiencies.

Results

Burden of nutritional deficiencies among reproductive-age women in India

The Figure 1 (A) provides a detailed analysis of nutritional deficiencies in India among reproductive-age women from 1990 to 2021, focusing on incidence. The incidence of nutritional deficiencies peaked around 4,000,000 cases annually between 1990 and 2005 but declined steadily to approximately 2,000,000 by 2021. In 2021, Vitamin A deficiency accounted for the highest incidence (2,233,982.85 cases), followed by protein-energy malnutrition (510,826.41 cases) and iodine deficiency (156,786.19 cases). Over time, protein-energy malnutrition and iodine deficiency declined, while Vitamin A deficiency remained significant. Figure 1 (B) provides a detailed analysis of DALYs attributed to nutritional deficiencies increased from 4,300,000 in 1990, peaked at 5,300,000 in the mid-2000s, and decreased to 4,700,000 by 2021. Protein-energy malnutrition dominated the DALY burden in 2021 with 4,529,352.46 DALYs (95%), while dietary iron deficiency (42,300.21 DALYs), Vitamin A deficiency (19,747.51 DALYs), iodine deficiency (14,660 DALYs), and other nutritional deficiencies (12,926.49 DALYs) contributed relatively less. The overall burden of both incidence and DALYs has declined over the years, with protein-energy malnutrition consistently being the most significant contributor.

epubh-07-1-a.jpg

Figure 1 (A): Incidence number attributed to nutritional deficiencies and main subcategories in India by calendar year from 1990 to 2021, among reproductive age group women.

Table 1 presents the incidence and mortality rates of nutritional deficiencies among reproductive-age women in India from 1990 to 2021, along with the percentage change and EAPC. Nationally, the incidence decreased significantly from 19,422.71 (1990) to 7,670.51 (2021) per 100,000 population, reflecting a 60.51% reduction (EAPC: -3.07). Similarly, the mortality rate declined from 2.91 to 0.42 per 100,000, showing an 85.51% reduction (EAPC: -6.23). States like Chhattisgarh and Telangana demonstrated the largest declines in mortality rates, with EAPCs of -8.21 and -8.07, respectively. Despite these improvements, variations persist, with some states, such as Bihar and Uttar Pradesh, exhibiting relatively higher incidence and mortality rates compared to others like Goa and Kerala.

epubh-07-1-b.jpg

Figure 1 (B): DALYs number attributed to nutritional deficiencies and main subcategories in India by calendar year from 1990 to 2021, among reproductive age group women.

Similarly, supplementary Table S1 illustrates the DALYs and prevalence of nutritional deficiencies among reproductive-age women in India from 1990 to 2021, along with percentage changes and EAPC. Nationally, DALYs decreased from 2,323.17 to 1,387.06 per 100,000 population, a 40.29% reduction (EAPC: -1.64). Prevalence also declined from 61,735.63 to 50,224.16 per 100,000, representing an 18.65% reduction (EAPC: -0.68). The steepest declines in DALYs were observed in Delhi (EAPC: -3.15) and Tamil Nadu (-3.09), while smaller reductions occurred in states like Arunachal Pradesh (-0.71). Prevalence reductions varied significantly, with the greatest improvements seen in states such as Sikkim (-29.57%, EAPC: -1.26) and Mizoram (-30.74%, EAPC: -1.29), indicating disparities in the progress made across different region.

Figure 2 visually shows the geographic distribution of age-standardized prevalence and DALY rates for nutritional deficiencies among reproductive-age women in India, comparing 1990 and 2021. In 1990, northern and central states like Uttar Pradesh and Bihar exhibited the highest prevalence (66,652–72,653 cases) and DALY rates (2,791–3,620 per 100,000), while southern and north-eastern states had lower burdens. By 2021, there was a notable nationwide decline in both prevalence and DALY rates, though northern states like Uttar Pradesh and Bihar still had the highest burden (prevalence: 50,753–99,992 cases; DALY rates: 1,564–1,860 per 100,000). This highlights persistent regional disparities despite overall improvement.

Table1: Incidence and mortality rates of nutritional deficiencies among reproductive age women in India

IncidenceDeath
Location19902021Percentage ChangeEAPC19902021Percentage ChangeEAPC
India19422.71 (15605.14 to 24547.87)7670.51 (6158.48 to 9456.99)-60.51 (-60.54 to -61.48)-3.07 (-3.27 to -2.86)2.91 (2.17 to 3.66)0.42 (0.34 to 0.52)-85.51 (-84.48 to -85.94)-6.23 (-6.6 to -5.86)
State
Andhra Pradesh22542.43 (16355.49 to 29735.07)7945.08 (5877.58 to 10669.87)-64.76 (-76.47 to -45.24)-3.47 (-3.61 to -3.33)1.44 (0.87 to 2.22)0.16 (0.1 to 0.23)-89.17 (-94.59 to -79.26)-6.96 (-7.37 to -6.54)
Arunachal Pradesh18305.69 (12911.02 to 24722.14)7034.85 (5101.33 to 9875.14)-61.57 (-75.12 to -38.23)-3.25 (-3.36 to -3.14)0.61 (0.4 to 0.93)0.18 (0.11 to 0.31)-71.08 (-82.88 to -50.24)-3.31 (-3.76 to -2.87)
Assam17093.94 (11845.51 to 23869.23)6967.46 (5159.35 to 9584.93)-59.24 (-72.81 to -37.1)-2.89 (-3.1 to -2.67)2.91 (2.06 to 3.91)0.46 (0.33 to 0.63)-84.35 (-90.56 to -73.56)-6.58 (-7.36 to -5.79)
Bihar23280.91 (17532.72 to 30632.74)11465.74 (8236.58 to 15265.99)-50.75 (-66.24 to -25.96)-2.45 (-2.89 to -2.01)2.56 (1.58 to 3.91)0.37 (0.24 to 0.54)-85.62 (-92.17 to -70.47)-5.94 (-6.39 to -5.48)
Chhattisgarh25296.47 (19006.88 to 32972.33)8444.63 (6252.48 to 11399.62)-66.62 (-77.33 to -51.1)-3.69 (-3.87 to -3.52)10.69 (5.99 to 19.03)0.85 (0.58 to 1.19)-92.05 (-96.3 to -83.28)-8.21 (-8.78 to -7.64)
Delhi9347.36 (6733.45 to 13138.45)4007.36 (3070.3 to 5290.17)-57.13 (-71.41 to -35.33)-2.96 (-3.13 to -2.78)1.47 (0.98 to 2.11)0.18 (0.12 to 0.26)-87.59 (-92.93 to -77.95)-6.76 (-7.21 to -6.31)
Goa8609.44 (6203.1 to 11991.52)4668.74 (3686.03 to 5947.23)-45.77 (-63.21 to -20.78)-2.47 (-2.63 to -2.3)1.74 (1.08 to 2.6)0.42 (0.27 to 0.61)-76.04 (-87.05 to -52.99)-4.05 (-4.29 to -3.8)
Gujarat16461.75 (11870.69 to 22137.98)6177.43 (4643.05 to 8182.52)-62.47 (-74.69 to -44.25)-3.22 (-3.41 to -3.02)1.46 (0.91 to 2.2)0.22 (0.16 to 0.29)-85.05 (-91.48 to -71.52)-6.14 (-6.68 to -5.59)
Haryana18884.92 (13234.05 to 26069.61)5688.29 (4230.56 to 7517.11)-69.88 (-80.39 to -54.34)-3.94 (-4.13 to -3.75)1.59 (1.17 to 2.08)0.51 (0.38 to 0.66)-67.61 (-77.68 to -50.04)-3.3 (-3.88 to -2.72)
Himachal Pradesh17455.29 (12076.07 to 23555.95)5423.76 (4065.08 to 7416.08)-68.93 (-79.42 to -50.6)-3.9 (-3.99 to -3.81)0.82 (0.54 to 1.15)0.08 (0.06 to 0.12)-89.79 (-94.27 to -82.68)-7.11 (-7.33 to -6.89)
Jammu & Kashmir and Ladakh17482.97 (12016.23 to 23684.51)6200.15 (4537.08 to 8589.07)-64.54 (-76.99 to -44.6)-3.53 (-3.63 to -3.43)0.64 (0.41 to 0.97)0.1 (0.08 to 0.14)-83.95 (-90.72 to -70.17)-5.8 (-5.96 to -5.64)
Jharkhand23368.94 (16673.09 to 30658.31)9125.41 (6600.99 to 12401.08)-60.95 (-73.48 to -40.9)-3.15 (-3.34 to -2.96)2.9 (1.86 to 4.37)0.34 (0.25 to 0.46)-88.17 (-93.34 to -79.15)-6.63 (-7.22 to -6.03)
Karnataka18504.48 (13410.83 to 24892.42)6889.86 (5110.33 to 9174.16)-62.77 (-74.65 to -43.5)-3.19 (-3.38 to -3)2.31 (1.52 to 3.27)0.32 (0.24 to 0.42)-86.29 (-91.73 to -76)-6 (-6.25 to -5.76)
Kerala11900.03 (8503.45 to 16598.65)5604.78 (4343.29 to 7068.08)-52.9 (-67.08 to -29.81)-2.74 (-2.87 to -2.61)0.22 (0.14 to 0.32)0.09 (0.07 to 0.12)-60.04 (-74.19 to -37.17)-2.16 (-2.56 to -1.76)
Madhya Pradesh23443.34 (17730.35 to 30619.7)8675.86 (6325.26 to 11323.24)-62.99 (-73.95 to -45.12)-3.19 (-3.47 to -2.9)3.98 (2.52 to 5.87)0.47 (0.34 to 0.63)-88.15 (-93.1 to -78.5)-6.74 (-7.42 to -6.05)
Maharashtra16077.88 (11781.41 to 21378.65)5856.13 (4520.66 to 7555.72)-63.58 (-74.64 to -46.14)-3.27 (-3.46 to -3.08)2.9 (2 to 3.95)0.45 (0.34 to 0.59)-84.58 (-90.57 to -75.25)-6.07 (-6.42 to -5.72)
Manipur12737.8 (8806.82 to 18121.91)6343.95 (4487.34 to 9211.96)-50.2 (-68.77 to -18.12)-2.24 (-2.34 to -2.14)0.8 (0.52 to 1.14)0.25 (0.16 to 0.37)-69.06 (-81.46 to -46.75)-3.51 (-3.86 to -3.16)
Meghalaya17022.23 (11904.52 to 23462.51)8227.05 (6126.3 to 11293.12)-51.67 (-68.36 to -23.86)-2.53 (-2.64 to -2.42)0.52 (0.33 to 0.73)0.11 (0.07 to 0.17)-77.83 (-86.83 to -60.92)-4.23 (-4.96 to -3.5)
Mizoram12969.94 (9288.4 to 18054.27)5961.65 (4495.84 to 8160.63)-54.03 (-69.17 to -27.37)-2.5 (-2.7 to -2.31)0.05 (0.04 to 0.07)0.01 (0.01 to 0.02)-72.52 (-84.66 to -52.13)-4.11 (-4.49 to -3.73)
Nagaland11948.54 (8349.77 to 16259.61)5300.95 (3883.91 to 7012.43)-55.64 (-70.25 to -33.7)-2.71 (-2.83 to -2.59)0.73 (0.46 to 1.04)0.18 (0.11 to 0.27)-75.09 (-87.5 to -54.37)-4.37 (-4.72 to -4.03)
Odisha22497.99 (16385.29 to 29139.74)7707.67 (5652.86 to 10391.67)-65.74 (-77.39 to -49.19)-3.6 (-3.73 to -3.48)3.53 (2.34 to 5.13)0.5 (0.33 to 0.72)-85.96 (-92.86 to -72.83)-6.12 (-6.68 to -5.55)
Other Union Territories10981.43 (7905.24 to 15453.95)5160.81 (3866.38 to 6707.04)-53 (-67.84 to -28.5)-3.06 (-3.32 to -2.8)3.04 (1.49 to 6.08)0.18 (0.12 to 0.27)-94.06 (-97.49 to -85.87)-5.9 (-6.33 to -5.46)
Punjab13351.57 (9433.07 to 19182.05)5446.77 (3992.06 to 7320.85)-59.21 (-73.39 to -36.18)-3.05 (-3.22 to -2.87)1.21 (0.79 to 1.71)0.22 (0.16 to 0.3)-81.57 (-89.42 to -68.63)-4.91 (-5.14 to -4.68)
Rajasthan24634.26 (18053.05 to 33020.4)8459.17 (6068.53 to 11404.96)-65.66 (-77.85 to -48.06)-3.52 (-3.78 to -3.25)1.59 (1.1 to 2.19)0.26 (0.18 to 0.36)-83.64 (-90.04 to -72.48)-6.19 (-6.95 to -5.42)
Sikkim16301.8 (11051.79 to 21967.69)6122.68 (4559.86 to 8369.65)-62.44 (-74.68 to -41.5)-3.58 (-3.75 to -3.41)0.4 (0.22 to 0.62)0.06 (0.03 to 0.09)-85.36 (-91.88 to -74.74)-6.14 (-6.69 to -5.6)
Tamil Nadu15821.98 (11477.69 to 21458.51)6374.26 (4826.78 to 8417.79)-59.71 (-72.58 to -39.32)-3.14 (-3.26 to -3.01)4.91 (3.32 to 6.64)0.59 (0.42 to 0.86)-87.93 (-93.01 to -79.57)-6.78 (-7.05 to -6.51)
Telangana23323.57 (16732.19 to 31140.12)7606.84 (5608.02 to 10309.98)-67.39 (-77.62 to -49.64)-3.82 (-3.97 to -3.68)2.39 (1.42 to 3.61)0.2 (0.11 to 0.32)-91.72 (-96.23 to -82.93)-8.07 (-8.55 to -7.59)
Tripura17111.94 (12452.68 to 23136.86)8110.21 (5926.09 to 10691.73)-52.6 (-68.5 to -26.79)-2.6 (-2.7 to -2.51)1.07 (0.69 to 1.65)0.26 (0.17 to 0.39)-75.66 (-87.18 to -55.2)-4.14 (-4.56 to -3.72)
Uttar Pradesh21950.01 (16105.97 to 28963.55)8442.08 (6099.09 to 11764.12)-61.54 (-74.23 to -42.47)-4.1 (-4.27 to -3.92)4.32 (2.9 to 6.01)0.72 (0.52 to 0.96)-83.28 (-89.85 to -73.07)-7.13 (-7.71 to -6.55)
Uttarakhand15989.48 (11353.29 to 21280.34)4949.13 (3748.55 to 6824.17)-69.05 (-79.65 to -54.08)-2.65 (-2.83 to -2.48)4.7 (3.05 to 7.22)0.56 (0.4 to 0.79)-88.11 (-93.06 to -76.79)-6.79 (-7.03 to -6.55)
West Bengal17320.57 (12394.43 to 23353.97)7725.33 (5808.7 to 10120.28)-55.4 (-70.28 to -31.75)-2.67 (-2.78 to -2.56)2.09 (1.29 to 3.33)0.26 (0.19 to 0.35)-87.41 (-93.04 to -77.64)-9.65 (-10.03 to -9.27)

In Figure 3, a joinpoint regression analysis delineates the ASR of nutritional deficiencies among reproductive-age women, evaluating metrics including the ASIR, prevalence, ASR DALYs, and ASMR. The ASIR identified three significant trend shifts in 2005, with an APC of -2.08, indicative of a decreasing trend. Conversely, a modest uptick is observed between 2019 and 2021, with an APC increase to 0.72. The ASR DALYs show a pronounced and continuous decline over an extended period from 1990 to 2021, articulated through six joinpoints. Similarly, the prevalence rate per 100,000 population demonstrates a marked reduction, particularly sharp in the latter segment from 2019 to 2021, where the APC plummeted to -4.92. These findings underscore the dynamic and evolving landscape of nutritional health challenges and achievements within this demographic group.

Figure 4 provides a detailed analysis of DALYs for specific nutritional deficiencies among reproductive-age women in India, highlighting dietary iron deficiency, iodine deficiency, protein-energy malnutrition, other nutritional deficiencies, and vitamin A deficiency. The data from 2021 exhibits significant variations in the burden of these deficiencies across states, with dietary

iron deficiency and protein-energy malnutrition being particularly prominent. Panel A quantifies the absolute numbers of DALYs associated with these deficiencies, demonstrating the extensive impact of dietary iron deficiency, which stands out as a critical health issue for reproductive-age women in many states. Other dietary deficiencies, which encompass inadequate intakes of essential nutrients other than iron, also contribute significantly to the total DALYs, reflecting widespread nutritional challenges in this demographic. Panel B offers a visual representation of the proportional impact of each deficiency type within each state, using a stacked bar format. The prominence of bars related to dietary iron deficiency and other dietary deficiencies in most states highlights the urgent need for targeted nutritional interventions. This stark portrayal underscores the necessity for enhanced public health initiatives such as nutritional education, supplementation programs, and broader access to healthcare services. These steps are crucial to improve the nutritional status and overall health outcomes for reproductive-age women in India. The prevalence of dietary and iron deficiencies, in particular, stresses the importance for policymakers and health organizations to prioritize and implement effective strategies aimed at reducing these specific nutritional burdens.

epubh-07-02.jpg

Figure 2: Geographic distribution of age-standardized prevalence and DALY rates attributed to nutritional deficiencies among reproductive age group women in India, with comparisons between 1990 and 2021: (A) age-standardized prevalence, (B) age-standardized DALY rate.

Figure 5 provides a detailed depiction of the distribution of nutritional deficiencies and associated DALYs across different age groups, specifically focusing on women in the reproductive age bracket of 15-49 years. Panel A of the figure quantifies DALYs within this broad age group, revealing that certain deficiencies, such as protein-energy malnutrition and dietary iron deficiency, impose a significantly higher health burden compared to others like iodine deficiency or vitamin deficiency (Figure 5A). Figure 5B breaks down the DALYs within the reproductive age group further by narrower age categories, illustrating a potential trend where younger subgroups within this bracket may experience a higher burden of specific nutritional deficiencies. Panel C compares the proportion of DALY rates attributed to each nutritional deficiency across all age groups, enabling an assessment of the relative impact of each deficiency throughout different stages of life. This comprehensive analysis is critical for informing targeted public health interventions and policies to mitigate the impact of nutritional deficiencies among reproductive-age women.

Socio-Demographic index and nutritional deficiencies in India

Figure 6 analyses the relationship between temporal trends in age-standardized DALY rates for nutritional deficiencies among reproductive-age women and the SDI across regions. Panel A shows a general decline in DALY rates over time, with variations across locations, indicating improvements in addressing nutritional deficiencies. Panel B explores the correlation between the EAPC in DALY rates and SDI, revealing a moderate negative correlation (R = -0.28, p = 0.13). While higher SDI levels are associated with greater reductions in DALY rates, the correlation is not statistically significant. These findings highlight the role of socio-economic factors in influencing nutritional outcomes.

epubh-7-3-ab.jpg

epubh-7-3-cd.jpg

Figure 3: Joinpoint analysis of nutritional deficiencies among reproductive-age group women: (A) age-standardized incidence rate, (B) age-standardized prevalence, (C) age-standardized DALY rate, (D) age-standardized death rate.

Forecasting nutritional deficiencies

Figure 7, supported by data from supplementary Table S2, presents ARIMA-based forecasts for nutritional deficiencies among reproductive-age women in India, highlighting trends in incidence, prevalence, DALYs, and death rates through 2031. The incidence rate is projected to decline from 7,208.57 per 100,000 in 2022 (95% CI: 6,959.36–7,457.78) to 4,162.75 per 100,000 in 2030 (95% CI: 3,028.81–5,296.69). Prevalence shows a gradual reduction from 49,938.51 per 100,000 in 2022 (95% CI: 49,763.99–50,113.04) to 47,653.34 per 100,000 in 2030 (95% CI: 43,652.69–51,654.00). DALYs are expected to decrease from 1,371.05 per 100,000 (95% CI: 1,355.93–1,386.18) in 2022 to 1,242.99 per 100,000 (95% CI: 987.69–1,498.29) in 2030, reflecting continued reductions in disease burden. The death rate, starting at 0.38 per 100,000 in 2022 (95% CI: 0.32–0.45), is forecasted to become statistically negligible by 2028, though widening

confidence intervals highlight increasing uncertainty over time. supplementary Table S2 provides detailed projections with 95% confidence intervals, emphasizing the need for sustained public health efforts to achieve these forecasted improvements.

Discussion

From 1990 to 2021, significant progress has been made in addressing nutritional deficiencies among reproductive-age women in India, with marked reductions in incidence, prevalence, DALYs, and mortality rates. Nationally, there has been a substantial decline in both incidence and mortality, reflecting the positive impact of improved interventions and healthcare systems. Similarly, DALYs and prevalence have also shown a notable decrease. However, disparities persist, particularly in states like Uttar Pradesh and Bihar, which continue to experience a disproportionately higher burden. Protein-energy malnutrition remains the primary contributor to DALYs, followed by deficiencies in vitamin A and dietary iron. Projections suggest that these trends will continue, with further reductions in incidence, DALYs, and prevalence expected in the coming years.

epubh-7-4-a.jpg

epubh-7-4-b.jpg

Figure 4: Distribution of subcategories of nutritional deficiencies and DALYs in India: (A) DALY numbers with subcategories of nutritional deficiencies, (B) proportional plot of DALYs attributed to nutritional deficiencies across all states, for the years 1990 and 2021.

Additionally, prior studies indicate that women in this age group face significant risks of being underweight or overweight, with variations influenced by age, socioeconomic status, and geographic location. For instance, younger women (20-24 years) are more likely to be underweight, while older women (45-49 years) face higher risks of being overnourished [11]. In rural areas, undernutrition is more prevalent, exacerbated by limited access to diverse diets and healthcare resources [12]. Indigenous communities, such as those in Attappady, Kerala, exhibit poor dietary diversity, with diets heavily reliant on cereals and starchy staples, leading to chronic energy deficiencies and micronutrient inadequacies, particularly in iron, calcium, and vitamin A [13, 14]. The prevalence of anemia remains alarmingly high, affecting approximately 73.9% of women, with significant associations between nutritional status and factors like age at marriage and body mass index [15]. epubh-7-5-a.jpg

epubh-7-5-b.jpg

epubh-7-5-c.jpg

Figure 5: Distribution of nutritional deficiencies subcategories: (A) DALY cases in the broad age group 15-49 years; (B) age-wise distribution of DALYs in the reproductive age group; and (C) proportion of DALY rates across age groups.

In Punjab, deficiencies in iron, zinc, vitamin B12, and folate are prevalent, suggesting the potential benefits of interventions like multiply-fortified salt (MFS) to address these gaps [16]. Despite a general decline in undernutrition from 32.8% to 27.1% over two decades, disparities persist across different states and social groups, highlighting the need for targeted interventions [17]. Addressing these nutritional challenges requires culturally sensitive approaches, particularly in indigenous and low-income communities, to improve dietary diversity and micronutrient intake through education, food fortification, and policy reforms [18, 19].

Anemia remains a major health concern among reproductive-age women in India, affecting a significant proportion of this population. Approximately one-third of Indian women in this age group are undernourished, and over 56% suffer from iron deficiency anemia, which is notably higher than in many other countries [14, 20, 21]. Indigenous women in India face particularly severe nutritional challenges, with deficits in the intake of essential food groups such as pulses, green leafy vegetables, and dairy products, leading to a high risk of deficiencies in iron, calcium, and vitamin A [14]. This nutritional inadequacy is compounded by socio-economic factors, as women from lower wealth quintiles are more likely to be undernourished [22]. In comparison, developed countries face a different spectrum of nutritional issues, with obesity and related disorders being more prevalent, affecting reproductive health through mechanisms such as anovulation and increased pregnancy complications [23]. The dual burden of malnutrition in India, characterized by both undernutrition and rising obesity rates, reflects a demographic and dietary transition, with a notable increase in overweight and obesity among women over the past two decades [21]. This contrasts with the situation in many developed countries where obesity is a more dominant issue. Nutritional interventions in India, such as the provision of energy-dense food supplements, have shown promise in improving weight gain among underweight women during preconception and pregnancy [24]. However, the persistent high rates of anemia and undernutrition highlight the need for comprehensive nutritional programs that address both macro and micronutrient deficiencies, integrated with family planning services to mitigate the potential increase in fertility associated with improved nutrition [25].

Nutritional deficiencies among women of reproductive age (WRA) are a significant global health concern, with varying prevalence and impacts across different countries.

epubh-07-6a.jpeg

epubh-07-6b.jpg

Figure 6: (A) Temporal trends in age-standardized DALY rates associated with nutritional deficiencies and their relationship with SDI among reproductive-age women, (B) Correlation between the estimated annual percentage change (EAPC) and the Socio-Demographic Index (SDI).

In low- and middle-income countries, dietary diversity is often inadequate, leading to insufficient intake of essential micronutrients such as calcium, iron, zinc, and vitamins A, B12, and folate, which are crucial for reproductive health [18]. For instance, in Bangladesh, a high percentage of WRA, particularly adolescent girls, suffer from inadequate intake of these nutrients, exacerbated by socio-economic factors like low educational levels and income [26]. Similarly, in Ethiopia, chronic energy malnutrition is prevalent, with underweight conditions being more common among rural, unemployed, and less educated women [26]. In Sudan, the consumption of micronutrient-rich foods is moderate among reproductive-age women,

but iron deficiency and anemia remain significant issues [27]. In Turkey, agricultural workers face high rates of anemia and deficiencies in vitamin B12 and folate, highlighting the need for targeted public health interventions [28]. Comparatively, in South Asia and Sub-Saharan Africa, the burden of nutritional deficiencies, particularly iodine and vitamin A, has been increasing, with significant implications for maternal and child health [19]. These deficiencies are not solely linked to economic factors but are also influenced by social and cultural capital, necessitating comprehensive strategies that include food fortification, supplementation programs, and community awareness initiatives to address these disparities [19, 29]. Overall, addressing nutritional deficiencies in WRA requires a multifaceted approach that considers regional disparities and socio-economic determinants to improve health outcomes effectively.

epubh-07-07.jpg

Figure 7: Forecast plot of nutritional deficiencies among reproductive-age women: (A) age-standardized incidence rate, (B) age-standardized prevalence, (C) age-standardized DALY rate, (D) age-standardized death rate.

Nutritional deficiencies in India are influenced by a complex interplay of risk factors, and the effectiveness of existing programs and policies. The country faces a triple burden of malnutrition, characterized by undernutrition, overnutrition, and micronutrient deficiencies, affecting a significant portion of the population, including children, pregnant women, and adolescents [30-32]. Risk factors include inadequate agricultural productivity, lack of education, gender inequality, and poor public distribution systems, which exacerbate food insecurity and malnutrition [3, 33]. The economic impact is substantial, with malnutrition contributing to a loss of 3-4% of India's

GDP due to decreased productivity [3]. Despite various government initiatives like the Integrated Child Development Services (ICDS) and the National Iron+ Initiative, the full potential of these programs is not realized due to inadequate implementation and monitoring [31, 34]. The government has set ambitious goals, such as reducing anemia and achieving universal access to iodized salt, but challenges persist due to insufficient strategic planning and resource allocation. To address these issues, a multisectoral approach is necessary, focusing on improving agricultural practices, enhancing food storage, and ensuring equitable access to nutrition programs, particularly in rural and marginalized communities [3]. Additionally, community awareness and education campaigns are crucial to promote better dietary practices and address the underlying social determinants of health. Overall, while progress has been made, a coordinated effort involving policy reform, community engagement, and robust monitoring systems is essential to effectively combat nutritional deficiencies in India [30]. The results of this study underscore the importance of sustained and multifaceted public health interventions to continue reducing nutritional deficiencies among reproductive-age women in India. By examining long-term trends and projecting future scenarios, this research supports and guides ongoing efforts to achieve Sustainable Development Goal 2, aiming to end malnutrition in all its forms by 2030.

This study's strength lies in its comprehensive use of sophisticated statistical models like EAPC, joinpoint regression, and ARIMA, allowing for a detailed analysis of trends and future projections of nutritional deficiencies among reproductive-age women in India. Such robust methodology enhances the reliability of the findings and their applicability in policy-making and public health strategies. However, a limitation of the study is its reliance on secondary data from the GBD, which may include inconsistencies in data collection methods across different regions and time periods. Additionally, the study might not fully capture the impact of localized health initiatives that could affect nutritional outcomes, nor does it account for the socio-economic changes post-2021, which could influence future trends.

Conclusion

This study successfully highlighted the significant reductions in nutritional deficiencies among reproductive-age women in India over a 31-year period, evidenced by a consistent decrease in EAPC and confirmed through joinpoint APC and ARIMA analyses. The EAPC indicates a significant reduction in nutritional deficiency rates, while the APC analysis confirms a substantial decreasing trend. ARIMA forecasts predict a continued decline, with rates projected to decrease by 2030.These outcomes underscore the effectiveness of longitudinal public health interventions and the need for ongoing policy efforts and resource allocation. This study aligns with the SDG to end all forms of malnutrition by 2030, emphasizing the importance of sustained interventions to reduce nutritional deficiencies. It suggests a continued focus on tailored interventions to address regional disparities and strengthen the reduction of nutritional deficiencies among reproductive-age women in India, thereby contributing significantly to global nutrition and health targets.

Abbreviations

GBD: Global Burden of Diseases

SDGs: Sustainable Development Goal

ICD: International Classification of Diseases

EAPC: Estimated Annual Percentage Change

UI: Uncertainty Intervals

ASMR: Age Standardised Mortality Rate

ASR DALYs: Age Standardised Disability Adjusted Life Years

WHO: World Health Organisation

AIC: Akaike Information Criterion

ARIMA: Autoregressive Integrated Moving Average

BIC: Bayesian Information Criterion

CI: Confidence Interval

AAPC: Average Annual Percentage Change

Supporting information: None

Ethical Considerations: This study employed data from the publicly accessible GBD Study 2021, presented by the Institute for Health Metrics and Evaluation (IHME), the Indian Council of Medical Research (ICMR), and the Public Health Foundation of India (PHFI). The dataset was meticulously compiled and anonymized to eliminate any personally identifiable information, thereby eliminating the requirement for ethical approval and informed consent.

Acknowledgments: The authors acknowledge the Global Burden of Disease Study 2021 for providing the data.

Funding: This research received no specific grant from any funding agency in the public, commercial, or not-for-profit sectors.

Author contribution statement: All authors (AJ, JR, DSL, SDM, PS) contributed equally and attest they meet the ICMJE criteria for authorship and gave final approval for submission.

Data availability statement: Data used in this study is manuscript available at (https://vizhub.healthdata.org/gbd-results/).

Additional information: No additional information is available for this paper.

Declaration of competing interest: The authors declared no potential conflicts of interest with respect to the research, authorship, and/or publication of this article.

Clinical Trial: Not applicable

Consent for publication: Note applicable

References

[1] Bharati S, Pal M, Som S, Bharati P. Temporal trend of anemia among reproductive-aged women in India. Asia Pac J Public Health. 2015;27(2):NP1193-NP207. [Crossref][PubMed][Google Scholar]

[2] Saini R, Bajpai M. Malnutrition: A Longstanding Challenge in India. Current Nutrition & Food Science. 2024;20(9):1069-85. [Crossref][PubMed][Google Scholar]

[3] Upadhyay RP. Curbing malnutrition and micronutrient deficiencies in India. Food based strategies at the centre of a holistic approach. 2011. [Crossref][PubMed][Google Scholar]

[4] Agarwal S, Sethi V. Nutritional disparities among women in urban India. J Health Popul Nutr. 2013;31(4):531. [Crossref][PubMed][Google Scholar]

[5] Ghose MA, Inamdar P, Bagchi P. Reproductive health of women in India: A sociological and legal overview. IJHS. 6 S4 (2022). [Crossref][PubMed][Google Scholar]

[6] Ayaz Q, Rouf A, Kanojia V, Naik H, Altaf U, Qadri T, et al. Nutritional disorders in India and their alleviation through counseling and diet modification. 2018;7(3):451-457. [Crossref][PubMed][Google Scholar]

[7] Harika R, Faber M, Samuel F, Kimiywe J, Mulugeta A, Eilander A. Micronutrient Status and Dietary Intake of Iron, Vitamin A, Iodine, Folate and Zinc in Women of Reproductive Age and Pregnant Women in Ethiopia, Kenya, Nigeria and South Africa: A Systematic Review of Data from 2005 to 2015. Nutrients. 2017;9(10). [Crossref][PubMed][Google Scholar]

[8] Mao C, Shen Z, Long D, Liu M, Xu X, Gao X, et al. Epidemiological study of pediatric nutritional deficiencies: an analysis from the global burden of disease study 2019. Nutr J. 2024;23(1):44. [Crossref][PubMed][Google Scholar]

[9] Jena D, Swain P, Gandhi N, Guthi V, TY SS SS. Cancer Burden and trends across India (1990–2021): insights from the Global Burden of Disease study. The Evidence. 2024;2(3). [Crossref][PubMed][Google Scholar]

[10] Jena D, Padhi BK, Zahiruddin QS, Ballal S, Kumar S, Bhat M, et al. Estimation of burden of cancer incidence and mortality in India: based on global burden of disease study 1990–2021. BMC cancer. 2024;24(1):1-19. [Crossref][PubMed][Google Scholar]

[11] Kumar R, Barik S. Double burden of Malnutrition among women in Reproductive Age (15-49 Years) in India: Evidence from National Family and Health Survey 2019-21 (NFHS-5). 2024. [Crossref][PubMed][Google Scholar]

[12] Ghosh K, Chakraborty AS, Haloi B, Zakir S. Spatial Clustering of Malnutrition and Anemia Among Reproductive Women and Its Associated Risk Factors in India: Evidence From National Family Health Survey-5. Food Nutr Bull. 2024;45(1):3-11. [Crossref][PubMed][Google Scholar]

[13] Sunu P, Jaleel A, Neeraja G, Jayalakshmi G, Narasimhulu D, Senthilkumar B, et al. Diet and Nutritional Status of Women of Reproductive Age (15–49 Years) in Indigenous Communities of Attappady, Kerala, India. Nutrients. 2024;16(16):2698. [Crossref][PubMed][Google Scholar]

[14] Kapoor R, Sabharwal M, Ghosh-Jerath S. Diet quality, nutritional adequacy and anthropometric status among indigenous women of reproductive age group (15–49 Years) in India: A narrative review. Dietetics. 2022;2(1):1-22. [Crossref][PubMed][Google Scholar]

[15] Sahu PC, Inamdar IFAA, Purohit L, Sahu AC. Nutritional status of reproductive age group women: A community-based study. J Family Med Prim Care. 2023;12(6):1113-7. [Crossref][PubMed][Google Scholar]

[16] Goh YE, Manger MS, Duggal M, Das R, Saklani S, Agarwal S, et al. Women in selected communities of Punjab, India have a high prevalence of Iron, Zinc, Vitamin B12, and Folate deficiencies: Implications for a multiply-fortified salt intervention. Nutrients. 2023;15(13):3024. [Crossref][PubMed][Google Scholar]

[17] Chaudhuri S, Agiwal V, Nirupama A, Kumar Y. Changing Landscape of Undernutrition in Reproductive-Age Indian Women: Analysis of the nationally representative data, 1998-2021. 2024. . [Crossref][PubMed][Google Scholar]

[18] Islam MH, Nayan MM, Jubayer A, Amin MR. A review of the dietary diversity and micronutrient adequacy among the women of reproductive age in low‐and middle‐income countries. Food Sci Nutr. 2024;12(3):1367-79. [Crossref][PubMed][Google Scholar]

[19] Jiang S, Liu J, Qi X, Wang R, Wang X, Wang K, et al. Global, regional, and National Estimates of nutritional deficiency burden among reproductive women from 2010 to 2019. Nutrients. 2022;14(4):832. [Crossref][PubMed][Google Scholar]

[20] Jose S. Are good times good for women? Alarming increase in women's malnutrition in India. Indian Journal of Gender Studies. 2008;15(1):127-40. [Crossref][PubMed][Google Scholar]

[21] Yaya S, Ghose B. Change in nutritional status among women of childbearing age in India (1998–2016). Obes Sci Pract. 2020;6(5):535-43. [Crossref][PubMed][Google Scholar]

[22] Chowdhury R, Taneja S, Dhabhai N, Mazumder S, Upadhyay RP, Sharma S, et al. Burden of preconception morbidity in women of reproductive age from an urban setting in North India. PLoS One. 2020;15(6):e0234768. [Crossref][PubMed][Google Scholar]

[23] Group ECW. Nutrition and reproduction in women. Human Reproduction Update. 2006;12(3):193-207. [Crossref][PubMed][Google Scholar]

[24] Dhabhai N, Chowdhury R, Taneja S, Shekhar M, Kaur J, Mittal P, et al. Management of undernutrition during preconception and pregnancy in an urban setting in North India. Front Public Health. 2024;12:1405247. [Crossref][PubMed][Google Scholar]

[25] Gupta PS. Malnutrition, fertility and family planning. Journal of the Indian Medical Association. 1979;72(8):194-9. [Crossref][PubMed][Google Scholar]

[26] Akter R, Sugino H, Akhter N, Brown CL, Thilsted SH, Yagi N. Micronutrient adequacy in the diet of reproductive-aged adolescent girls and adult women in rural Bangladesh. Nutrients. 2021;13(2):337. [Crossref][PubMed][Google Scholar]

[27] Swareldhab ESE, Al-Jawaldeh A, Qureshi AB, Ali AME, Abu-Manga M, Al-Areeqi M, et al. Assessment of Micronutrient Situation among Reproductive-Age Women (15–49) and under-five children in Sudan. Nutrients. 2021;13(8):2784. [Crossref][PubMed][Google Scholar]

[28] Simsek Z, Atalay B, Keklik AZ, Akbaba M, Ertem M. Epidemiology of micronutrient deficiencies in agricultural reproductive-aged female workers in Southeastern Anatolia, Turkey. turjoem. 2018;3(1):9-9. [Crossref][PubMed][Google Scholar]

[29] Hasan MM, Magalhaes RJS, Al Mamun A. Disparities in the prevalence of malnutrition of reproductive women and under five children in low-and middle-income countries (P04-103-19). Current Developments in Nutrition. 2019;3:nzz051 P04-103-19. [Crossref][PubMed][Google Scholar]

[30] Sharma D. Nutrition security in India: Determinants and policies. Health Science Journal. 2019;13(3):1-7. [Crossref][PubMed][Google Scholar]

[31] Sreedevi A. An overview of the development and status of national nutritional programs in India. Journal of Medical Nutrition and Nutraceuticals. 2015;4(1):5-13. [Crossref][PubMed][Google Scholar]

[32] Basheer S, Ashique V, Grover A. The Food and Nutrition Status in India: A Systematic Review. Sustainable Health Through Food, Nutrition, and Lifestyle. 2023:143-59. [Crossref][PubMed][Google Scholar]

[33] Shankar B, Agrawal S, Beaudreault AR, Avula L, Martorell R, Osendarp S, et al. Dietary and nutritional change in India: implications for strategies, policies, and interventions. Annals of the New York Academy of Sciences. 2017;1395(1):49-59. [Crossref][PubMed][Google Scholar]

[34] Sadaf S. Current Status of Malnutrition in India and Government Initiatives to Improve Nutrition and Health. Journal of Drug Vigilance and Alternative Therapies. 2021;1(4):135-42. [Crossref][PubMed][Google Scholar]

Disclaimer / Publisher’s NoteThe statements, opinions and data contained in all publications are solely those of the individual author(s) and contributor(s) and not of Journals and/or the editor(s). Journals and/or the editor(s) disclaim responsibility for any injury to people or property resulting from any ideas, methods, instructions or products referred to in the content.